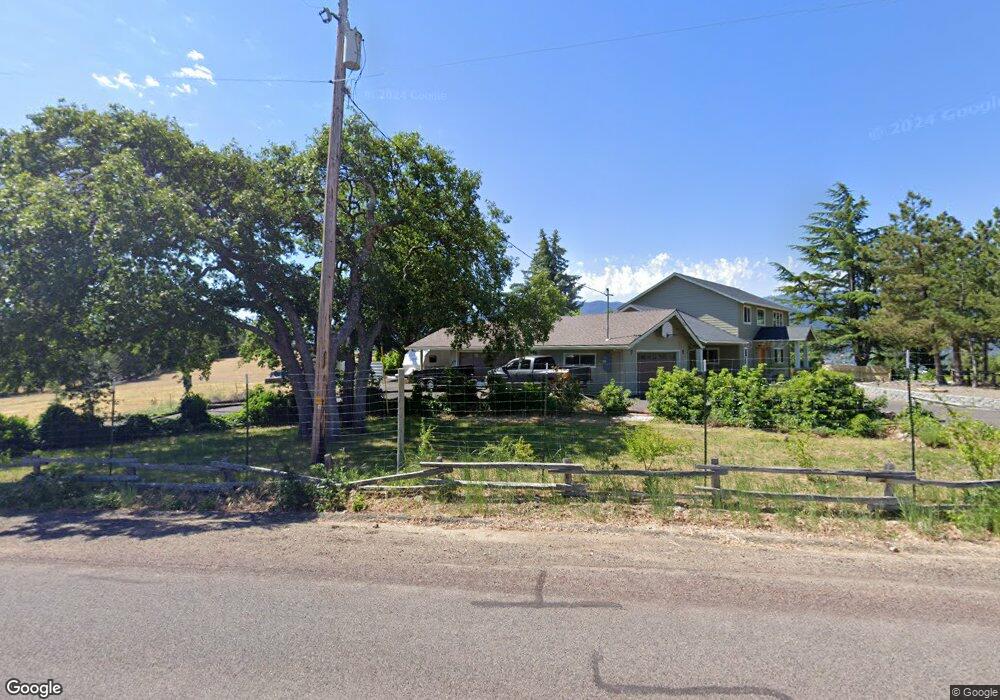
160 Pompadour Dr Ashland, OR 97520
Estimated Value: $696,000 - $900,295
3
Beds
2
Baths
2,966
Sq Ft
$263/Sq Ft
Est. Value
About This Home
This home is located at 160 Pompadour Dr, Ashland, OR 97520 and is currently estimated at $779,098, approximately $262 per square foot. 160 Pompadour Dr is a home located in Jackson County with nearby schools including Helman Elementary School, Ashland Middle School, and Ashland High School.
Ownership History
Date
Name
Owned For
Owner Type
Purchase Details
Closed on
Feb 5, 2020
Sold by
Seidler Ramon J
Bought by
Seidler Ramon J and The Ramon J Seidler Trust
Current Estimated Value
Purchase Details
Closed on
Jun 2, 2009
Sold by
Britton Martha H and Keller Diane B
Bought by
Seidler Ramon J
Home Financials for this Owner
Home Financials are based on the most recent Mortgage that was taken out on this home.
Original Mortgage
$417,000
Outstanding Balance
$259,607
Interest Rate
4.5%
Mortgage Type
Commercial
Estimated Equity
$519,491
Purchase Details
Closed on
Feb 13, 2009
Sold by
Britton Martha H
Bought by
Britton Martha H and Keller Diana B
Purchase Details
Closed on
May 17, 2006
Sold by
Britton E Robert and Britton Martha H
Bought by
Britton E Robert and Britton Martha H
Create a Home Valuation Report for This Property
The Home Valuation Report is an in-depth analysis detailing your home's value as well as a comparison with similar homes in the area
Home Values in the Area
Average Home Value in this Area
Purchase History
| Date | Buyer | Sale Price | Title Company |
|---|---|---|---|
| Seidler Ramon J | -- | None Available | |
| Seidler Ramon J | $630,000 | First American | |
| Britton Martha H | -- | None Available | |
| Britton E Robert | -- | None Available |
Source: Public Records
Mortgage History
| Date | Status | Borrower | Loan Amount |
|---|---|---|---|
| Open | Seidler Ramon J | $417,000 |
Source: Public Records
Tax History Compared to Growth
Tax History
| Year | Tax Paid | Tax Assessment Tax Assessment Total Assessment is a certain percentage of the fair market value that is determined by local assessors to be the total taxable value of land and additions on the property. | Land | Improvement |
|---|---|---|---|---|
| 2025 | $9,258 | $652,560 | $271,330 | $381,230 |
| 2024 | $9,258 | $633,560 | $387,150 | $246,410 |
| 2023 | $8,956 | $615,110 | $375,870 | $239,240 |
| 2022 | $8,666 | $615,110 | $375,870 | $239,240 |
| 2021 | $8,366 | $597,200 | $364,930 | $232,270 |
| 2020 | $8,086 | $579,810 | $354,300 | $225,510 |
| 2019 | $7,958 | $546,540 | $333,970 | $212,570 |
| 2018 | $7,433 | $530,630 | $324,250 | $206,380 |
| 2017 | $7,347 | $530,630 | $324,250 | $206,380 |
| 2016 | $7,124 | $500,180 | $305,650 | $194,530 |
| 2015 | $6,975 | $500,180 | $305,650 | $194,530 |
| 2014 | $6,443 | $471,480 | $288,120 | $183,360 |
Source: Public Records
Map
Nearby Homes
- 1440 E Nevada St
- 500 Pompadour Dr
- 786 Pompadour Dr
- 0 E Nevada St
- 1650 E Nevada St
- 1320 N Mountain Ave
- 245 Majestic Ln
- 992 Golden Aspen Place Unit 48
- 913 Mountain Meadows Cir
- 920 Mountain Meadows Cir
- 954 Golden Aspen Place Unit 11
- 910 Mountain Meadows Cir
- 941 Mountain Meadows Cir Unit 20
- 955 Golden Aspen Place Unit 12
- 949 Golden Aspen Place
- 923 Mountain Meadows Cir Unit 12
- 1330 N Mountain Ave
- 63 Crocker St
- 75 Brooks Ln
- 833 Cobblestone Ct
- 0 Pompadour Dr Unit 100981411
- 0 Pompadour Dr Unit 100206587
- 0 Pompadour Dr Unit 5477740
- 0 Pompadour Dr
- 40 Pilot View Rd
- 220 Pompadour Dr
- 120 Pilot View Rd
- 165 Pilot View Rd
- 199 Pompadour Dr
- 331 Pompadour Dr
- 175 Pilot View Rd
- 166 Pilot View Rd
- 158 Gaerky Creek Rd
- 475 Pompadour Dr
- 53 Pompadour Dr
- 131 Gaerky Creek Rd
- 1368 E Nevada St
- 300 Gaerky Creek Rd
- 320 Gaerky Creek Rd
- 26 Pompadour Dr