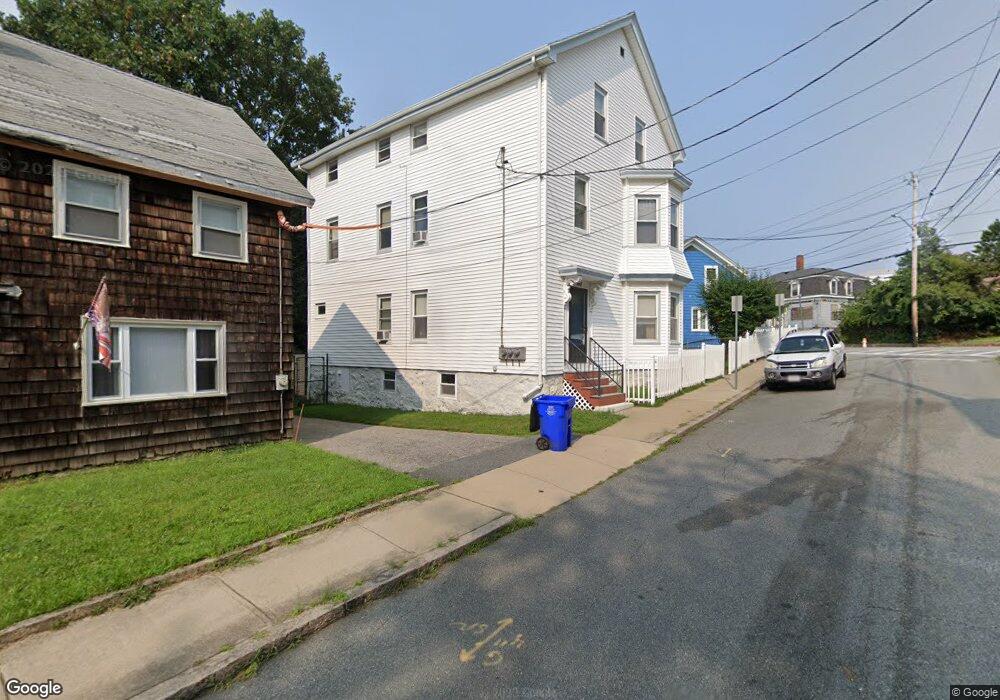
160 Riverview St Fall River, MA 02724
Sandy Beach NeighborhoodEstimated Value: $475,000 - $586,000
6
Beds
3
Baths
2,589
Sq Ft
$198/Sq Ft
Est. Value
About This Home
This home is located at 160 Riverview St, Fall River, MA 02724 and is currently estimated at $512,667, approximately $198 per square foot. 160 Riverview St is a home located in Bristol County with nearby schools including Carlton M. Viveiros Elementary School, Matthew J. Kuss Middle School, and B M C Durfee High School.
Ownership History
Date
Name
Owned For
Owner Type
Purchase Details
Closed on
Nov 1, 2011
Sold by
Cummigs Cheryl
Bought by
Richard A Manuels Irt and Cummings
Current Estimated Value
Purchase Details
Closed on
Sep 19, 2011
Sold by
Manuels Michael A
Bought by
Cummings Cheryl
Purchase Details
Closed on
Jan 16, 2004
Sold by
Manuels Belmira T and Cummings Cheryl
Bought by
Manuels Belmira T Est and Cummings
Create a Home Valuation Report for This Property
The Home Valuation Report is an in-depth analysis detailing your home's value as well as a comparison with similar homes in the area
Home Values in the Area
Average Home Value in this Area
Purchase History
| Date | Buyer | Sale Price | Title Company |
|---|---|---|---|
| Richard A Manuels Irt | -- | -- | |
| Cummings Cheryl | $61,667 | -- | |
| Manuels Belmira T Est | -- | -- |
Source: Public Records
Tax History
| Year | Tax Paid | Tax Assessment Tax Assessment Total Assessment is a certain percentage of the fair market value that is determined by local assessors to be the total taxable value of land and additions on the property. | Land | Improvement |
|---|---|---|---|---|
| 2025 | $4,723 | $412,500 | $105,200 | $307,300 |
| 2024 | $4,520 | $393,400 | $101,300 | $292,100 |
| 2023 | $3,942 | $321,300 | $83,700 | $237,600 |
| 2022 | $3,366 | $279,200 | $79,700 | $199,500 |
| 2021 | $3,366 | $243,400 | $75,900 | $167,500 |
| 2020 | $3,061 | $211,800 | $74,800 | $137,000 |
| 2019 | $2,642 | $181,200 | $72,000 | $109,200 |
| 2018 | $2,576 | $176,200 | $78,000 | $98,200 |
| 2017 | $2,415 | $172,500 | $74,300 | $98,200 |
| 2016 | $2,384 | $174,900 | $79,100 | $95,800 |
| 2015 | $2,288 | $174,900 | $79,100 | $95,800 |
| 2014 | $2,282 | $181,400 | $76,700 | $104,700 |
Source: Public Records
Map
Nearby Homes
- 245 Dwelly St
- 464 Birch St
- 20 Wilcox St
- 609 King Philip St
- 1846 S Main St
- 1852 S Main St
- 1334 S Main St
- 1273-1279 S Main St
- 70 Brown St
- 234 Kilburn St
- 15 Higgins St
- 57 Larouche St
- 917 Dwelly St
- 616 Woodman St
- 126 Wheeler St
- 344-354 E Main St
- 24 Valley St
- 700 Shore Dr Unit 6-604
- 700 Shore Dr Unit 1205
- 700 Shore Dr Unit 810
Your Personal Tour Guide
Ask me questions while you tour the home.