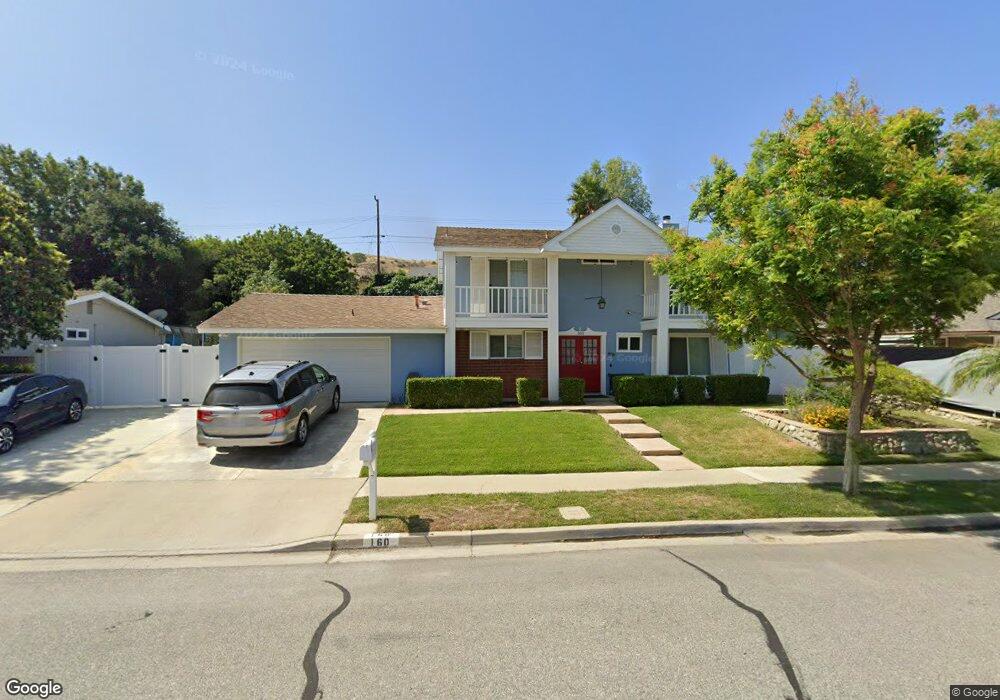
160 Triangle St Thousand Oaks, CA 91360
Estimated Value: $1,076,000 - $1,116,050
5
Beds
3
Baths
1,994
Sq Ft
$551/Sq Ft
Est. Value
About This Home
This home is located at 160 Triangle St, Thousand Oaks, CA 91360 and is currently estimated at $1,098,013, approximately $550 per square foot. 160 Triangle St is a home located in Ventura County with nearby schools including Aspen Elementary School, Redwood Middle School, and Thousand Oaks High School.
Ownership History
Date
Name
Owned For
Owner Type
Purchase Details
Closed on
Aug 3, 2020
Sold by
Lucarelli Spenser C and Lucarelli Denise J
Bought by
Lucarelli Spenser C and Lucarelli Denise J
Current Estimated Value
Home Financials for this Owner
Home Financials are based on the most recent Mortgage that was taken out on this home.
Original Mortgage
$455,000
Interest Rate
2.8%
Mortgage Type
New Conventional
Purchase Details
Closed on
Apr 11, 2016
Sold by
Lucarelli Spenser C and Lucarelli Denise J
Bought by
Lucarelli Family Trust and Lucarelli Denise J
Home Financials for this Owner
Home Financials are based on the most recent Mortgage that was taken out on this home.
Original Mortgage
$395,200
Interest Rate
3.65%
Mortgage Type
New Conventional
Purchase Details
Closed on
Mar 23, 2016
Sold by
Lucarelli Spenser C and Lucarelli Denise J
Bought by
Lucarelli Spenser and Lucarelli Denise
Home Financials for this Owner
Home Financials are based on the most recent Mortgage that was taken out on this home.
Original Mortgage
$395,200
Interest Rate
3.65%
Mortgage Type
New Conventional
Purchase Details
Closed on
Feb 10, 2015
Sold by
Lucarelli Spenser and Lucarelli Denise
Bought by
Lucarelli Family Trust and Lucarelli Denise
Home Financials for this Owner
Home Financials are based on the most recent Mortgage that was taken out on this home.
Original Mortgage
$397,500
Interest Rate
3.66%
Mortgage Type
New Conventional
Purchase Details
Closed on
Mar 18, 2014
Sold by
Lucarelli Spenser C and Lucarelli Denise J
Bought by
Lucarelli Spenser C and Lucarelli Denise J
Home Financials for this Owner
Home Financials are based on the most recent Mortgage that was taken out on this home.
Original Mortgage
$400,000
Interest Rate
4.32%
Mortgage Type
New Conventional
Purchase Details
Closed on
Dec 6, 2013
Sold by
Lucarelli Spenser and Lucarelli Denise
Bought by
Lucarelli Spenser C and Lucarelli Denise J
Purchase Details
Closed on
Dec 7, 2012
Sold by
Fineroff Denise
Bought by
Fineroff Denise and Lucarelli Spenser
Purchase Details
Closed on
Jun 6, 2002
Sold by
Fineroff Marv and Fineroff Geraldine
Bought by
Fineroff Denise
Home Financials for this Owner
Home Financials are based on the most recent Mortgage that was taken out on this home.
Original Mortgage
$318,750
Interest Rate
6.78%
Mortgage Type
Stand Alone First
Create a Home Valuation Report for This Property
The Home Valuation Report is an in-depth analysis detailing your home's value as well as a comparison with similar homes in the area
Purchase History
| Date | Buyer | Sale Price | Title Company |
|---|---|---|---|
| Lucarelli Spenser C | -- | Solidifi | |
| Lucarelli Spenser C | -- | Solidifi | |
| Lucarelli Family Trust | -- | Accommodation | |
| Lucarelli Spenser | -- | First American Title Company | |
| Lucarelli Family Trust | -- | Accommodation | |
| Lucarelli Spenser | -- | North American Title Co Inc | |
| Lucarelli Spenser C | -- | First American Title Company | |
| Lucarelli Spenser C | -- | First American Title Company | |
| Lucarelli Spenser C | -- | None Available | |
| Fineroff Denise | -- | None Available | |
| Fineroff Denise | $255,000 | -- |
Source: Public Records
Mortgage History
| Date | Status | Borrower | Loan Amount |
|---|---|---|---|
| Closed | Lucarelli Spenser C | $455,000 | |
| Closed | Lucarelli Spenser | $395,200 | |
| Closed | Lucarelli Spenser | $397,500 | |
| Closed | Lucarelli Spenser C | $400,000 | |
| Closed | Fineroff Denise | $318,750 |
Source: Public Records
Tax History
| Year | Tax Paid | Tax Assessment Tax Assessment Total Assessment is a certain percentage of the fair market value that is determined by local assessors to be the total taxable value of land and additions on the property. | Land | Improvement |
|---|---|---|---|---|
| 2025 | $6,013 | $538,863 | $187,513 | $351,350 |
| 2024 | $6,013 | $528,298 | $183,837 | $344,461 |
| 2023 | $5,830 | $517,940 | $180,233 | $337,707 |
| 2022 | $5,726 | $507,785 | $176,699 | $331,086 |
| 2021 | $5,003 | $438,417 | $173,234 | $265,183 |
| 2020 | $4,583 | $433,923 | $171,458 | $262,465 |
| 2019 | $4,461 | $425,416 | $168,097 | $257,319 |
| 2018 | $4,371 | $417,075 | $164,801 | $252,274 |
| 2017 | $4,286 | $408,898 | $161,570 | $247,328 |
| 2016 | $4,245 | $400,881 | $158,402 | $242,479 |
| 2015 | $4,170 | $394,862 | $156,024 | $238,838 |
| 2014 | $4,110 | $387,129 | $152,969 | $234,160 |
Source: Public Records
Map
Nearby Homes
- 331 Triangle St
- 417 W Columbia Rd
- 2219 Goldsmith Ave
- 139 Prentiss St
- 1633 Montgomery Rd
- 136 Erten St
- 285 Siesta Ave
- 176 W Gainsborough Rd
- 21 Westbury St
- 1229 Coventry Dr
- 181 W Avenida de Las Flores
- 807 Briar Cliff Rd
- 2578 Calle Abedul
- 250 W Avenida de Las Flores
- 187 Tennyson St
- 195 Tennyson St
- 1016 Saxon Place
- 970 Calle Nogal
- 334 W Avenida de Las Flores
- 2797 Beckett Ct
- 186 Triangle St
- 138 Triangle St
- 167 W Columbia Rd
- 179 W Columbia Rd
- 208 Triangle St
- 169 Triangle St
- 153 Triangle St
- 131 W Columbia Rd
- 191 W Columbia Rd
- 113 W Columbia Rd
- 191 Triangle St
- 131 Triangle St
- 230 Triangle St
- 209 W Columbia Rd
- 213 Triangle St
- 109 Triangle St
- 166 Kevin St
- 144 Kevin St
- 166 W Columbia Rd
- 154 W Columbia Rd
Your Personal Tour Guide
Ask me questions while you tour the home.