
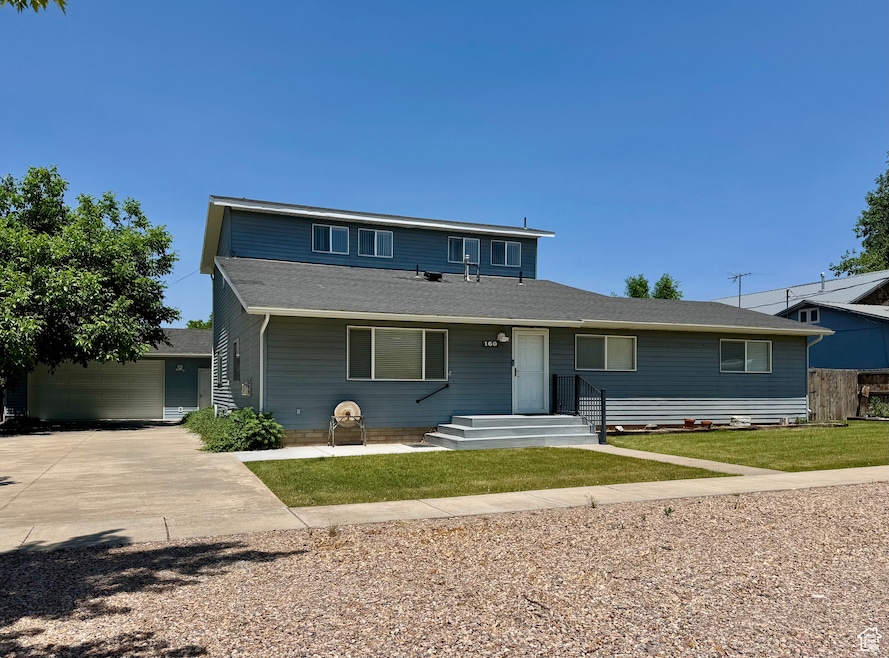

160 W 100 S Fillmore, UT 84631
Estimated payment $2,125/month
Total Views
1,584
3
Beds
3
Baths
2,700
Sq Ft
$129
Price per Sq Ft
Highlights
- Hot Property
- Mature Trees
- Secluded Lot
- Updated Kitchen
- Mountain View
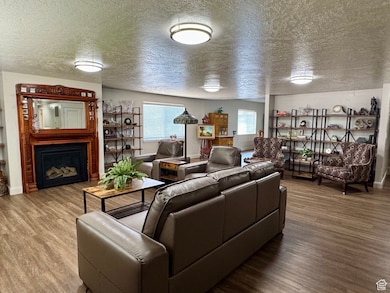
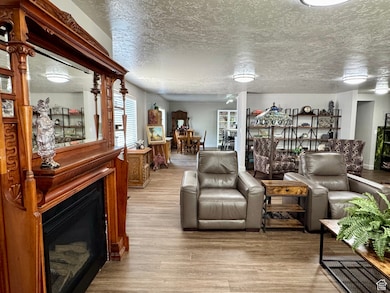
- 1 Fireplace
About This Home
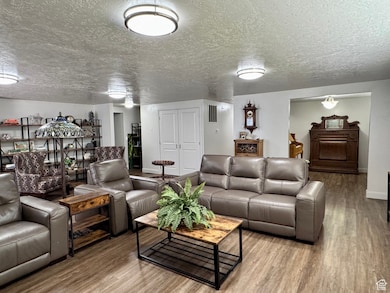
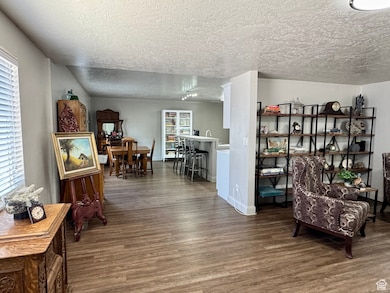
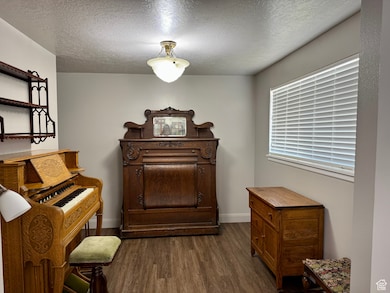
This recently remodeled, immaculate home is such a find in Fillmore! Main level has been updated with a spacious primary bedroom/bathroom that boasts a separate tub and shower. Updated flooring, beautiful finishes & fixtures, and even a new front porch. The sale includes range, refrigerator, washer, dryer, freezer, barstools in the kitchen and 1/4 share of irrigation water. Upstairs has additional bedroom with it's own bathroom and walk-in closet, as well as a nice family room and vaulted ceilings. Oversized garage with 2nd garage door on back side. Enjoy your beautiful yard this summer under the covered patio. Mature yard is full of trees & shrubs and is easy to maintain. Seller is willing to contribute to buyer's closing costs!
Listing Agent
Signature Real Estate Services Inc License #5483669 Listed on: 06/05/2025
Home Details
Home Type
- Single Family
Est. Annual Taxes
- $2,232
Year Built
- Built in 1972
Lot Details
- 0.38 Acre Lot
- Lot Dimensions are 100.0x165.0x100.0
- Property is Fully Fenced
- Landscaped
- Secluded Lot
- Sprinkler System
- Mature Trees
- Vegetable Garden
- Property is zoned Single-Family, R-2
Parking
- 2 Car Garage
Interior Spaces
- 2,700 Sq Ft Home
- 2-Story Property
- 1 Fireplace
- Blinds
- Great Room
- Den
- Carpet
- Mountain Views
- Storm Doors
Kitchen
- Updated Kitchen
- Free-Standing Range
- Freezer
- Disposal
Bedrooms and Bathrooms
- 3 Bedrooms | 2 Main Level Bedrooms
- Bathtub With Separate Shower Stall
Laundry
- Dryer
- Washer
Outdoor Features
- Covered patio or porch
- Outbuilding
Schools
- Fillmore Elementary And Middle School
- Millard High School
Utilities
- Forced Air Heating and Cooling System
- Natural Gas Connected
Community Details
- No Home Owners Association
Listing and Financial Details
- Assessor Parcel Number F-282-1
Map
Create a Home Valuation Report for This Property
The Home Valuation Report is an in-depth analysis detailing your home's value as well as a comparison with similar homes in the area
Home Values in the Area
Average Home Value in this Area
Tax History
| Year | Tax Paid | Tax Assessment Tax Assessment Total Assessment is a certain percentage of the fair market value that is determined by local assessors to be the total taxable value of land and additions on the property. | Land | Improvement |
|---|---|---|---|---|
| 2024 | $2,232 | $208,651 | $20,292 | $188,359 |
| 2023 | $2,232 | $208,651 | $20,292 | $188,359 |
| 2022 | $1,888 | $169,539 | $18,448 | $151,091 |
| 2021 | $1,683 | $145,083 | $11,979 | $133,104 |
| 2020 | $1,360 | $117,911 | $10,890 | $107,021 |
| 2019 | $1,150 | $100,010 | $10,890 | $89,120 |
| 2018 | $1,095 | $97,496 | $10,890 | $86,606 |
| 2017 | $852 | $72,135 | $10,890 | $61,245 |
| 2016 | $815 | $72,135 | $10,890 | $61,245 |
| 2015 | $815 | $72,135 | $10,890 | $61,245 |
| 2014 | -- | $72,135 | $10,890 | $61,245 |
| 2013 | -- | $72,135 | $10,890 | $61,245 |
Source: Public Records
Property History
| Date | Event | Price | Change | Sq Ft Price |
|---|---|---|---|---|
| 06/23/2025 06/23/25 | Price Changed | $348,000 | -12.8% | $129 / Sq Ft |
| 06/05/2025 06/05/25 | For Sale | $399,000 | -- | $148 / Sq Ft |
Source: UtahRealEstate.com
Purchase History
| Date | Type | Sale Price | Title Company |
|---|---|---|---|
| Quit Claim Deed | -- | None Listed On Document | |
| Quit Claim Deed | -- | None Listed On Document | |
| Quit Claim Deed | -- | None Listed On Document | |
| Quit Claim Deed | -- | None Listed On Document | |
| Warranty Deed | -- | First American Title |
Source: Public Records
Similar Homes in Fillmore, UT
Source: UtahRealEstate.com
MLS Number: 2089801
APN: F-282-1
Disclaimer: Certain information contained herein is derived from information provided by parties other than Homes.com. All information provided is deemed reliable, but is not guaranteed to be accurate and should be independently verified.
![]() IDX information is provided exclusively for consumers’ personal, non-commercial use, that it may not be used for any purpose other than to identify prospective properties consumers may be interested in purchasing, and that the data is deemed reliable but is not guaranteed accurate by the MLS. Licensor is only providing the MLS Content and not other sources of data provided in the Product.
IDX information is provided exclusively for consumers’ personal, non-commercial use, that it may not be used for any purpose other than to identify prospective properties consumers may be interested in purchasing, and that the data is deemed reliable but is not guaranteed accurate by the MLS. Licensor is only providing the MLS Content and not other sources of data provided in the Product.
Based on information from the Wasatch Front Regional Multiple Listing Service, Inc.. All data, including all measurements and calculations of area, is obtained from various sources and has not been, and will not be, verified by broker or the MLS. All information should be independently reviewed and verified for accuracy. Properties may or may not be listed by the office/agent presenting the information.
Nearby Homes
- 110 S 100 W
- 900 Utah 99
- 180 W 300 S
- 30 E 300 S
- 245 W 300 N
- 380 N 200 St W
- 1700 E 200 Rd S
- 430 E Canyon Rd
- 405 E 500 St S
- 410 W 400 N
- 555 E 500 S
- 400 N 1100 St W
- 825 800 South Fillmore
- 1100 S 725 Rd W
- 775 E Valley View Rd
- 2155 N Cedar Mountain Rd
- 2835 N Cedar Mountain Rd
- 2505 N Cedar Mountain Rd
- 1200 N Cedar Mountain Rd
- 1615 W Sunflower Ln Unit 4