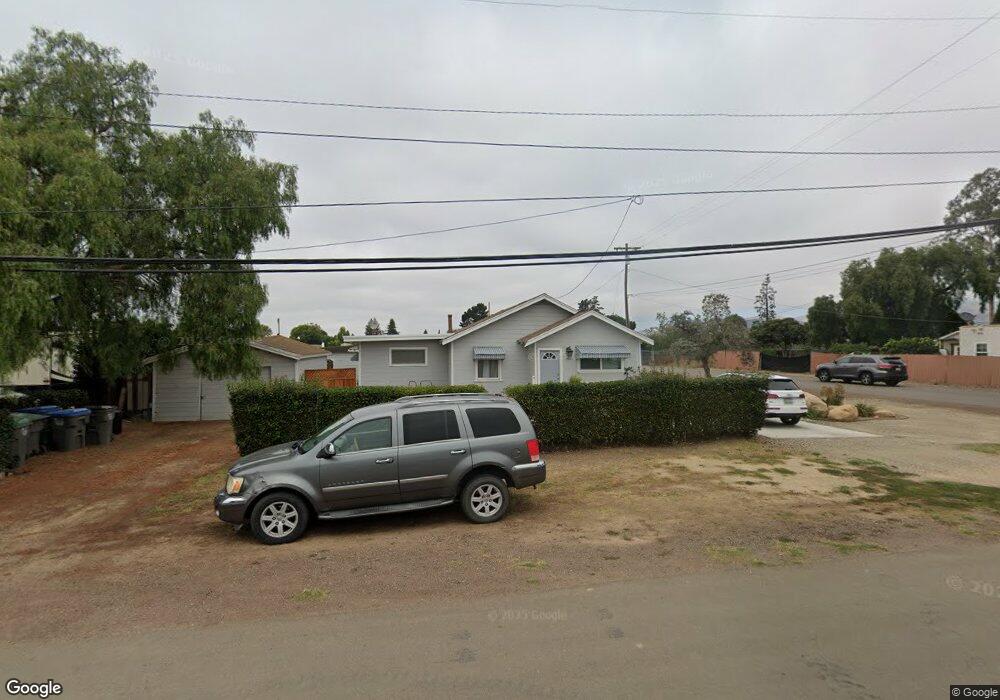
160 W Dana St Nipomo, CA 93444
--
Bed
--
Bath
1,128
Sq Ft
1.03
Acres
About This Home
This home is located at 160 W Dana St, Nipomo, CA 93444. 160 W Dana St is a home located in San Luis Obispo County with nearby schools including Nipomo Elementary School, Mesa Middle School, and Nipomo High School.
Ownership History
Date
Name
Owned For
Owner Type
Purchase Details
Closed on
Apr 14, 2021
Sold by
The Roman Catholic Bishop Of Monterey
Bought by
Duran Grace
Home Financials for this Owner
Home Financials are based on the most recent Mortgage that was taken out on this home.
Original Mortgage
$658,500
Interest Rate
2.9%
Mortgage Type
Commercial
Purchase Details
Closed on
Jan 21, 2009
Sold by
Marsalek Clifford L and Marsalek Maureen
Bought by
Marsalek Clifford L and Marsalek Maureen
Purchase Details
Closed on
Aug 7, 2008
Sold by
Marsalek Clifford L and Marsalek Maureen
Bought by
Marsalek Clifford L and Marsalek Maureen
Purchase Details
Closed on
Dec 5, 2007
Sold by
Mello Jane and Mello Louis Sebastian
Bought by
Mello Louis Sebastian and Mello Janet Ann
Purchase Details
Closed on
Apr 12, 2007
Sold by
Marsalek William
Bought by
Marsalek William D and Marsalek Ann M
Purchase Details
Closed on
Mar 17, 2005
Sold by
Marsalek Robert
Bought by
Marsalek Robert and Marsalek Janet
Create a Home Valuation Report for This Property
The Home Valuation Report is an in-depth analysis detailing your home's value as well as a comparison with similar homes in the area
Home Values in the Area
Average Home Value in this Area
Purchase History
| Date | Buyer | Sale Price | Title Company |
|---|---|---|---|
| Duran Grace | $788,500 | First American Title Company | |
| Marsalek Clifford L | -- | None Available | |
| Marsalek Clifford L | -- | None Available | |
| Mello Louis Sebastian | -- | None Available | |
| Marsalek William D | -- | None Available | |
| Marsalek Robert | -- | -- |
Source: Public Records
Mortgage History
| Date | Status | Borrower | Loan Amount |
|---|---|---|---|
| Previous Owner | Duran Grace | $658,500 |
Source: Public Records
Tax History Compared to Growth
Tax History
| Year | Tax Paid | Tax Assessment Tax Assessment Total Assessment is a certain percentage of the fair market value that is determined by local assessors to be the total taxable value of land and additions on the property. | Land | Improvement |
|---|---|---|---|---|
| 2025 | $7,771 | $755,536 | $430,807 | $324,729 |
| 2024 | $7,682 | $740,722 | $422,360 | $318,362 |
| 2023 | $7,682 | $726,199 | $414,079 | $312,120 |
| 2022 | $7,566 | $711,960 | $405,960 | $306,000 |
| 2021 | $3,395 | $313,759 | $253,097 | $60,662 |
| 2020 | $3,356 | $310,542 | $250,502 | $60,040 |
| 2019 | $3,336 | $304,454 | $245,591 | $58,863 |
| 2018 | $3,296 | $298,485 | $240,776 | $57,709 |
| 2017 | $3,234 | $292,633 | $236,055 | $56,578 |
| 2016 | $3,050 | $286,896 | $231,427 | $55,469 |
| 2015 | $3,007 | $282,587 | $227,951 | $54,636 |
| 2014 | $2,895 | $277,052 | $223,486 | $53,566 |
Source: Public Records
Map
Nearby Homes
- 1 W Branch St
- 0 S Burton St
- 90111003 W Price St
- 150 E Chestnut St
- 189 E Tefft St
- 449 W Tefft St Unit 23
- 449 W Tefft St Unit 13
- 400 N Oakglen Ave
- 160 San Antonio Ln
- 412 N Mallagh St
- 285 E Tefft St
- 525 Grande Ave Unit D
- 368 Avenida de Amigos
- 450 Avenida de Socios Unit 12
- Mesa Plan at Hill Street Terraces - Hill Street Series
- Pacific Plan at Hill Street Terraces - Hill Street Series
- Monarch Plan at Hill Street Terraces - Hill Street Series
- Rancho Plan at Hill Street Terraces - Hill Street Series
- Dana Plan at Hill Street Terraces - Hill Street Series
- 680 Hill St
- 0 E Dana St Unit 6-4782
- 0 E Dana St
- 146 S Burton St
- 162 S Burton St
- 151 W Dana St
- 151 W Dana St
- 151 W Dana St Unit 100
- 151 W Dana St Unit 100
- 151 W Dana St Unit 10
- 151 W Dana St Unit 200
- 151 W Dana St Unit 101
- 151 W Dana St Unit 201
- 151 W Dana St Unit 204
- 151 W Dana St Unit 202
- 151 W Dana St Unit 204
- 181 W Tefft St
- 163 E Dana St
- 163 W Dana St
- 158 S Burton St
- 175 S Burton St