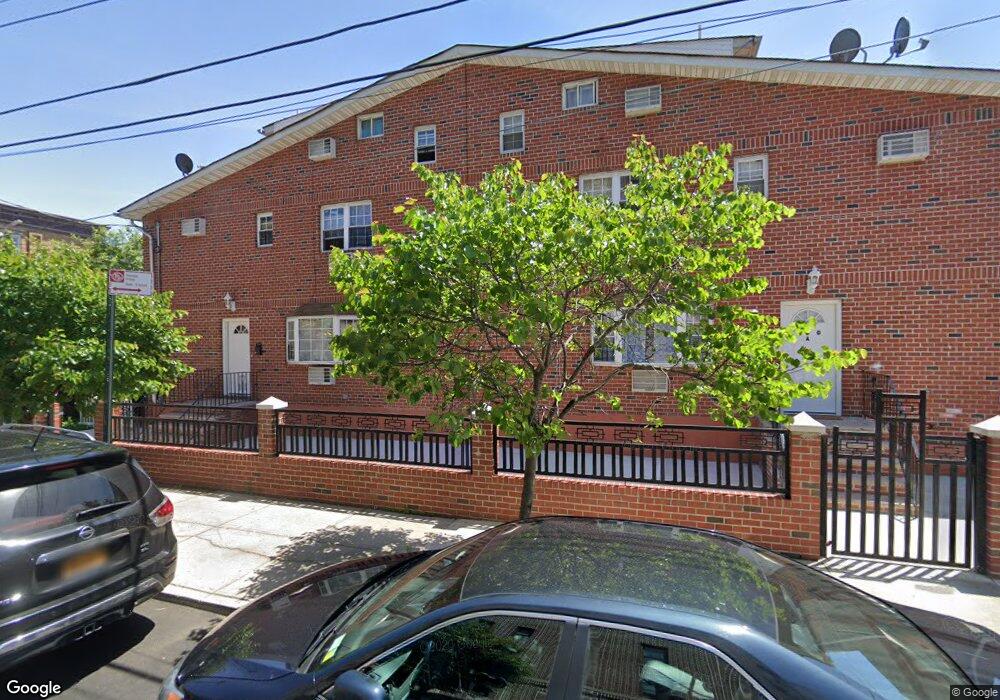
160 Weldon St Brooklyn, NY 11208
East New York NeighborhoodEstimated Value: $921,000 - $1,191,000
4
Beds
2
Baths
2,886
Sq Ft
$365/Sq Ft
Est. Value
About This Home
This home is located at 160 Weldon St, Brooklyn, NY 11208 and is currently estimated at $1,053,564, approximately $365 per square foot. 160 Weldon St is a home located in Kings County with nearby schools including P.S. 214 - Michael Friedsam, Cypress Hills Ascend Charter Lower School, and Blessed Sacrament School.
Ownership History
Date
Name
Owned For
Owner Type
Purchase Details
Closed on
Aug 26, 2019
Sold by
Rc Real Estate Management Llc
Bought by
Akter Nasrin and Akter Rabia
Current Estimated Value
Home Financials for this Owner
Home Financials are based on the most recent Mortgage that was taken out on this home.
Original Mortgage
$607,500
Outstanding Balance
$533,210
Interest Rate
3.7%
Mortgage Type
Purchase Money Mortgage
Estimated Equity
$520,354
Purchase Details
Closed on
May 9, 2017
Sold by
Sadek Golam
Bought by
Rc Real Estate Management Llc
Purchase Details
Closed on
Oct 7, 2002
Sold by
Built-Up Inc
Bought by
Sadek Golam
Home Financials for this Owner
Home Financials are based on the most recent Mortgage that was taken out on this home.
Original Mortgage
$359,100
Interest Rate
6.04%
Purchase Details
Closed on
Jun 15, 2001
Sold by
Clarke Donald L Ref and Hanif Raffickan Def
Create a Home Valuation Report for This Property
The Home Valuation Report is an in-depth analysis detailing your home's value as well as a comparison with similar homes in the area
Home Values in the Area
Average Home Value in this Area
Purchase History
| Date | Buyer | Sale Price | Title Company |
|---|---|---|---|
| Akter Nasrin | $810,000 | -- | |
| Rc Real Estate Management Llc | $253,000 | -- | |
| Sadek Golam | -- | -- | |
| -- | -- | -- |
Source: Public Records
Mortgage History
| Date | Status | Borrower | Loan Amount |
|---|---|---|---|
| Open | Akter Nasrin | $607,500 | |
| Previous Owner | Sadek Golam | $359,100 |
Source: Public Records
Tax History Compared to Growth
Tax History
| Year | Tax Paid | Tax Assessment Tax Assessment Total Assessment is a certain percentage of the fair market value that is determined by local assessors to be the total taxable value of land and additions on the property. | Land | Improvement |
|---|---|---|---|---|
| 2025 | $9,046 | $62,700 | $20,100 | $42,600 |
| 2024 | $9,046 | $55,500 | $20,100 | $35,400 |
| 2023 | $8,757 | $54,660 | $20,100 | $34,560 |
| 2022 | $8,132 | $51,360 | $20,100 | $31,260 |
| 2021 | $8,099 | $40,620 | $20,100 | $20,520 |
| 2020 | $6,074 | $39,660 | $20,100 | $19,560 |
| 2019 | $7,681 | $36,720 | $20,100 | $16,620 |
| 2018 | $7,160 | $35,123 | $19,775 | $15,348 |
| 2017 | $6,755 | $33,135 | $16,717 | $16,418 |
| 2016 | $6,249 | $31,260 | $20,100 | $11,160 |
| 2015 | $4,316 | $35,043 | $21,266 | $13,777 |
| 2014 | $4,316 | $33,060 | $22,320 | $10,740 |
Source: Public Records
Map
Nearby Homes
- 200 Mckinley Ave
- 351 Autumn Ave
- 367 Lincoln Ave
- 393 Crescent St
- 370 Crescent St
- 3412 Atlantic Ave
- 331 Lincoln Ave
- 400 Crescent St
- 18 Sheridan Ave
- 294 Hemlock St
- 371 Grant Ave
- 294 Autumn Ave
- 392 Eldert Ln
- 285 Lincoln Ave
- 368 Eldert Ln
- 1103 Glenmore Ave
- 407 Eldert Ln
- 304 Grant Ave
- 52 Forbell St
- 142 Forbell St
- 386 Autumn Ave
- 390 Autumn Ave
- 155 Weldon St
- 394 Autumn Ave
- 144 Weldon St
- 396 Autumn Ave
- 142 Weldon St
- 181 Mckinley Ave
- 395 Autumn Ave
- 395 Autumn Ave Unit 3
- 376 Autumn Ave
- 400 Autumn Ave
- 147 Weldon St
- 183 Mckinley Ave
- 138 Weldon St
- 143 Weldon St
- 372 Autumn Ave
- 402 Autumn Ave
- 167 Mckinley Ave
- 185 Mckinley Ave