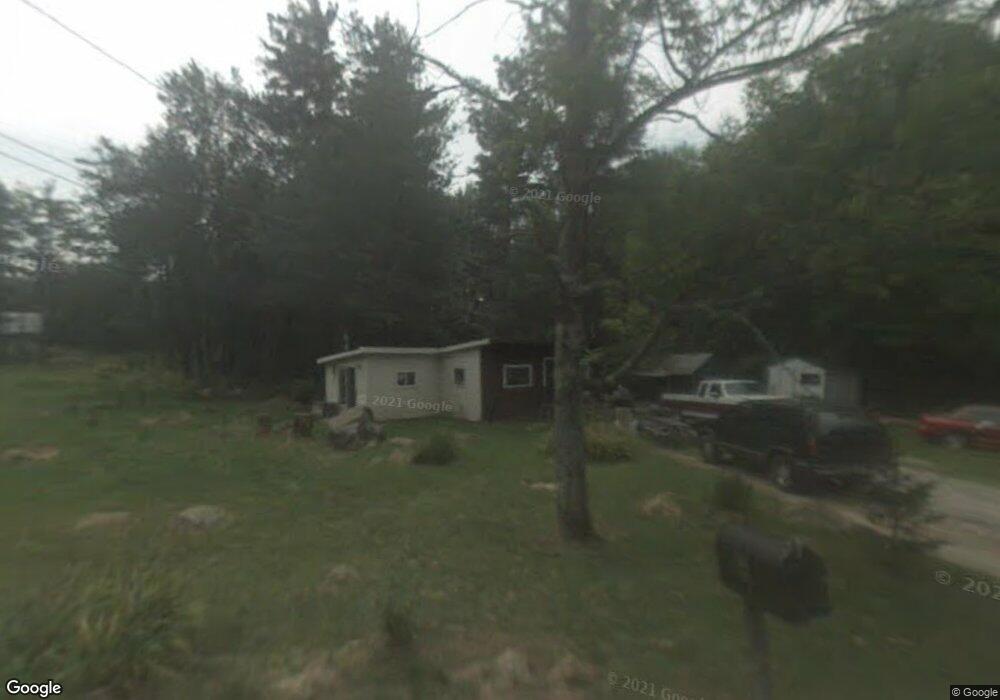
160 West Rd Bradford, NH 03221
Estimated Value: $250,788 - $325,000
2
Beds
1
Bath
848
Sq Ft
$332/Sq Ft
Est. Value
About This Home
This home is located at 160 West Rd, Bradford, NH 03221 and is currently estimated at $281,697, approximately $332 per square foot. 160 West Rd is a home located in Merrimack County with nearby schools including Kearsarge Regional Elementary School at Bradford, Kearsarge Regional Middle School, and Kearsarge Regional High School.
Ownership History
Date
Name
Owned For
Owner Type
Purchase Details
Closed on
Dec 8, 2011
Sold by
Pearce David G
Bought by
Wells Fargo Bank Na Tr
Current Estimated Value
Purchase Details
Closed on
Oct 2, 2006
Sold by
Lidstone Salem and Lidstone Jessica
Bought by
Pearce David G and Pearce Jane E
Home Financials for this Owner
Home Financials are based on the most recent Mortgage that was taken out on this home.
Original Mortgage
$142,405
Interest Rate
6.52%
Purchase Details
Closed on
Dec 12, 2003
Sold by
Butrim Cynthia L
Bought by
Lidstone Salem and Lidstone Jessica
Home Financials for this Owner
Home Financials are based on the most recent Mortgage that was taken out on this home.
Original Mortgage
$76,500
Interest Rate
5.9%
Mortgage Type
Purchase Money Mortgage
Create a Home Valuation Report for This Property
The Home Valuation Report is an in-depth analysis detailing your home's value as well as a comparison with similar homes in the area
Home Values in the Area
Average Home Value in this Area
Purchase History
| Date | Buyer | Sale Price | Title Company |
|---|---|---|---|
| Wells Fargo Bank Na Tr | $65,000 | -- | |
| Wells Fargo Bank Na Tr | $65,000 | -- | |
| Pearce David G | $149,900 | -- | |
| Pearce David G | $149,900 | -- | |
| Pearce David G | $149,900 | -- | |
| Lidstone Salem | $90,000 | -- | |
| Lidstone Salem | $90,000 | -- |
Source: Public Records
Mortgage History
| Date | Status | Borrower | Loan Amount |
|---|---|---|---|
| Previous Owner | Pearce David G | $142,405 | |
| Previous Owner | Lidstone Salem | $76,500 |
Source: Public Records
Tax History Compared to Growth
Tax History
| Year | Tax Paid | Tax Assessment Tax Assessment Total Assessment is a certain percentage of the fair market value that is determined by local assessors to be the total taxable value of land and additions on the property. | Land | Improvement |
|---|---|---|---|---|
| 2024 | $2,883 | $183,300 | $114,000 | $69,300 |
| 2023 | $2,727 | $98,100 | $58,000 | $40,100 |
| 2022 | $2,422 | $98,100 | $58,000 | $40,100 |
| 2021 | $2,346 | $98,100 | $58,000 | $40,100 |
| 2020 | $5,578 | $98,100 | $58,000 | $40,100 |
| 2019 | $5,340 | $76,700 | $38,000 | $38,700 |
| 2018 | $5,481 | $76,700 | $38,000 | $38,700 |
| 2017 | $2,025 | $76,700 | $38,000 | $38,700 |
| 2016 | $5,365 | $76,000 | $38,000 | $38,000 |
| 2015 | $2,049 | $76,000 | $38,000 | $38,000 |
| 2014 | $2,280 | $98,000 | $56,100 | $41,900 |
| 2013 | $2,197 | $98,000 | $56,100 | $41,900 |
Source: Public Records
Map
Nearby Homes
- 26 Butman Rd
- 375 West Rd
- 64 Rowe Mountain Rd
- 00 Fairgrounds Rd Unit 5
- 44 Pleasant View Rd
- 338 E Washington Rd
- 55 Water St
- 337 Rowe Mountain Rd
- 257 Jackson Rd
- 5 Greenhouse Ln
- 99 Newell Rd
- 200 South Rd
- 45 Crittenden Rd
- 108 Circle View Dr
- 2381 E Washington Rd
- 0 Bagley Hill Rd
- 71 Melvin Rd
- 00 Brookside Rd Unit 530-317&525-332
- 17 Jolly Farm Rd
- 6 Chapin Way Unit 6