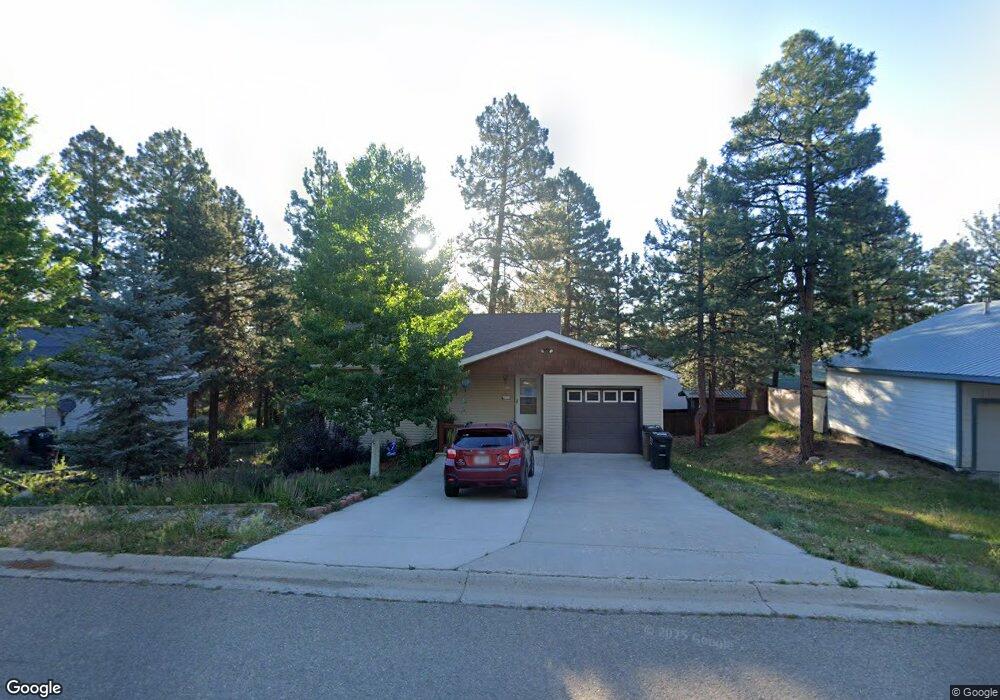
160 Westridge Rd Durango, CO 81303
Durango West NeighborhoodEstimated Value: $511,259 - $580,000
3
Beds
2
Baths
1,512
Sq Ft
$367/Sq Ft
Est. Value
About This Home
This home is located at 160 Westridge Rd, Durango, CO 81303 and is currently estimated at $555,065, approximately $367 per square foot. 160 Westridge Rd is a home located in La Plata County with nearby schools including Park Elementary School, Escalante Middle School, and Durango High School.
Ownership History
Date
Name
Owned For
Owner Type
Purchase Details
Closed on
Nov 7, 2014
Sold by
Rockwell Richard R and Rockwell Becky F
Bought by
Bunt Evan
Current Estimated Value
Home Financials for this Owner
Home Financials are based on the most recent Mortgage that was taken out on this home.
Original Mortgage
$190,000
Outstanding Balance
$146,666
Interest Rate
4.21%
Mortgage Type
New Conventional
Estimated Equity
$408,399
Purchase Details
Closed on
Oct 27, 2006
Sold by
Mccann Britt
Bought by
Rockwell Richard R and Rockwell Becky F
Home Financials for this Owner
Home Financials are based on the most recent Mortgage that was taken out on this home.
Original Mortgage
$21,800
Interest Rate
6.41%
Mortgage Type
Seller Take Back
Purchase Details
Closed on
May 13, 2005
Sold by
Perry Elizabeth Marie and Potter James Michael
Bought by
Mccann Britt
Home Financials for this Owner
Home Financials are based on the most recent Mortgage that was taken out on this home.
Original Mortgage
$218,471
Interest Rate
5.87%
Mortgage Type
FHA
Purchase Details
Closed on
Aug 4, 2000
Bought by
Bunt Evan
Create a Home Valuation Report for This Property
The Home Valuation Report is an in-depth analysis detailing your home's value as well as a comparison with similar homes in the area
Home Values in the Area
Average Home Value in this Area
Purchase History
| Date | Buyer | Sale Price | Title Company |
|---|---|---|---|
| Bunt Evan | $266,000 | Land Title Guarantee Company | |
| Rockwell Richard R | $259,000 | Colorado Land Title Company | |
| Mccann Britt | $221,900 | Colorado Land Title Co | |
| Bunt Evan | $85,700 | -- |
Source: Public Records
Mortgage History
| Date | Status | Borrower | Loan Amount |
|---|---|---|---|
| Open | Bunt Evan | $190,000 | |
| Previous Owner | Rockwell Richard R | $21,800 | |
| Previous Owner | Mccann Britt | $218,471 |
Source: Public Records
Tax History Compared to Growth
Tax History
| Year | Tax Paid | Tax Assessment Tax Assessment Total Assessment is a certain percentage of the fair market value that is determined by local assessors to be the total taxable value of land and additions on the property. | Land | Improvement |
|---|---|---|---|---|
| 2025 | $1,173 | $28,200 | $3,640 | $24,560 |
| 2024 | $1,005 | $23,930 | $2,730 | $21,200 |
| 2023 | $1,005 | $26,870 | $3,070 | $23,800 |
| 2022 | $812 | $19,130 | $3,090 | $16,040 |
| 2021 | $816 | $19,670 | $3,170 | $16,500 |
| 2020 | $811 | $20,150 | $2,980 | $17,170 |
| 2019 | $777 | $20,150 | $2,980 | $17,170 |
| 2018 | $716 | $18,580 | $3,010 | $15,570 |
| 2017 | $701 | $18,580 | $3,010 | $15,570 |
| 2016 | $631 | $18,120 | $3,320 | $14,800 |
| 2015 | $946 | $18,120 | $3,320 | $14,800 |
| 2014 | -- | $15,680 | $3,320 | $12,360 |
| 2013 | -- | $15,680 | $3,320 | $12,360 |
Source: Public Records
Map
Nearby Homes
- 30 Hawthorne Ct
- 66 Trail Wood Dr
- 220 Canyon Creek Trail
- 161 Canyon Creek Trail
- 178 Canyon Creek Trail
- 131 Holly Hock Trail
- 295 Wood Crest Dr
- 678 N Lakeside Dr
- 222 Pine Ridge Loop Unit A4
- 554 Oak Dr
- 49 Hunter Ct
- 23 Hunter Ct
- 841 Oak Dr
- 1100 Cr125
- 748 S Lakeside Dr
- 21121 Highway 140
- 717 Zane Dr
- 11846 W Hwy 160
- 11846 Us 160
- 621 Shenandoah Rd
- 144 Westridge Rd
- 174 Westridge Rd
- 95 Choke Cherry Cir
- 101 Choke Cherry Cir
- 0 Trailwood Unit 611599
- 0 Trailwood Unit 184 Trailwood Dr
- 0 Trailwood
- 151 Westridge Rd
- 126 Westridge Rd
- 167 Westridge Rd
- 0 Choke Cherry Cir Unit 574110
- 0 Choke Cherry Cir Unit 615006
- 0 Choke Cherry Cir Unit 638995
- 0 Choke Cherry Cir Unit 618817
- 0 Choke Cherry Cir Unit 647096
- 0 Choke Cherry Cir Unit 650462
- 0 Choke Cherry Cir Unit 657699
- 0 Choke Cherry Cir Unit Durango West 1
- 0 Choke Cherry Cir
- 190 Westridge Rd