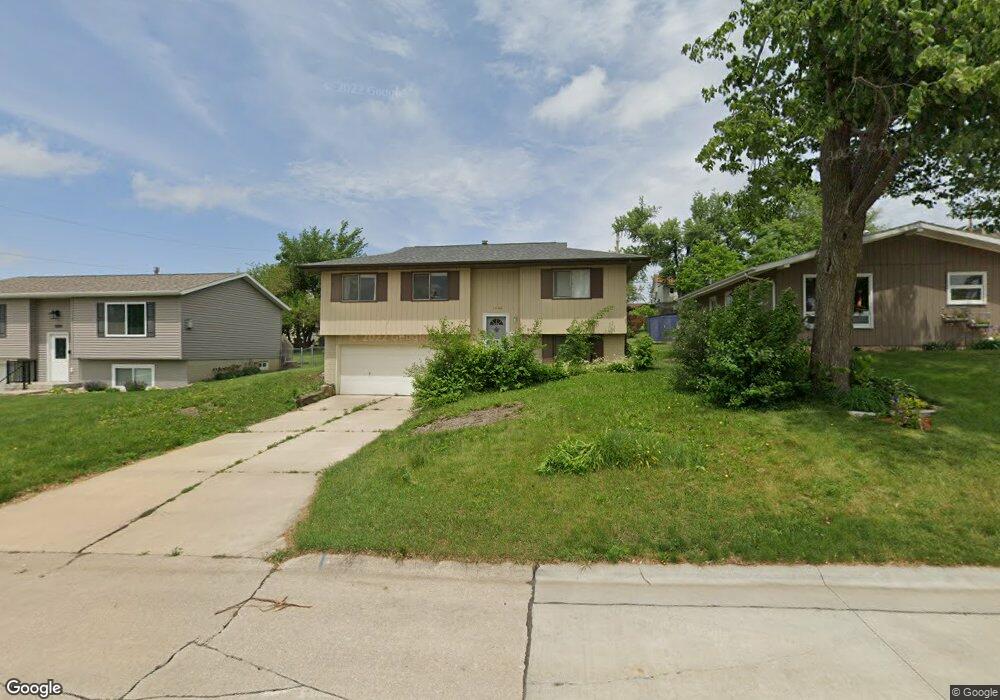
1600 2nd Ave Marion, IA 52302
Estimated Value: $158,000 - $192,000
3
Beds
1
Bath
1,231
Sq Ft
$143/Sq Ft
Est. Value
About This Home
This home is located at 1600 2nd Ave, Marion, IA 52302 and is currently estimated at $176,530, approximately $143 per square foot. 1600 2nd Ave is a home located in Linn County with nearby schools including Francis Marion Intermediate School, Starry Elementary School, and Vernon Middle School.
Ownership History
Date
Name
Owned For
Owner Type
Purchase Details
Closed on
Apr 25, 2012
Sold by
Thomson Michelle L and Schrupp Michelle L
Bought by
Schrupp Shane P
Current Estimated Value
Purchase Details
Closed on
May 6, 2010
Sold by
Brust James A
Bought by
Olivier Michelle L and Schrupp Shane P
Home Financials for this Owner
Home Financials are based on the most recent Mortgage that was taken out on this home.
Original Mortgage
$115,944
Interest Rate
4.87%
Mortgage Type
FHA
Purchase Details
Closed on
May 18, 2009
Sold by
Brust Susan E
Bought by
Brust James A
Create a Home Valuation Report for This Property
The Home Valuation Report is an in-depth analysis detailing your home's value as well as a comparison with similar homes in the area
Home Values in the Area
Average Home Value in this Area
Purchase History
| Date | Buyer | Sale Price | Title Company |
|---|---|---|---|
| Schrupp Shane P | -- | None Available | |
| Olivier Michelle L | $119,500 | None Available | |
| Brust James A | -- | None Available |
Source: Public Records
Mortgage History
| Date | Status | Borrower | Loan Amount |
|---|---|---|---|
| Previous Owner | Olivier Michelle L | $115,944 |
Source: Public Records
Tax History Compared to Growth
Tax History
| Year | Tax Paid | Tax Assessment Tax Assessment Total Assessment is a certain percentage of the fair market value that is determined by local assessors to be the total taxable value of land and additions on the property. | Land | Improvement |
|---|---|---|---|---|
| 2025 | $2,230 | $144,100 | $16,600 | $127,500 |
| 2024 | $2,492 | $129,300 | $16,600 | $112,700 |
| 2023 | $2,492 | $129,300 | $16,600 | $112,700 |
| 2022 | $2,406 | $120,900 | $16,600 | $104,300 |
| 2021 | $2,342 | $120,900 | $16,600 | $104,300 |
| 2020 | $2,342 | $112,200 | $16,600 | $95,600 |
| 2019 | $2,140 | $103,500 | $16,600 | $86,900 |
| 2018 | $2,088 | $103,500 | $16,600 | $86,900 |
| 2017 | $2,092 | $101,200 | $18,100 | $83,100 |
| 2016 | $2,252 | $101,200 | $18,100 | $83,100 |
| 2015 | $2,243 | $101,200 | $18,100 | $83,100 |
| 2014 | $2,050 | $101,200 | $18,100 | $83,100 |
| 2013 | $1,966 | $101,200 | $18,100 | $83,100 |
Source: Public Records
Map
Nearby Homes