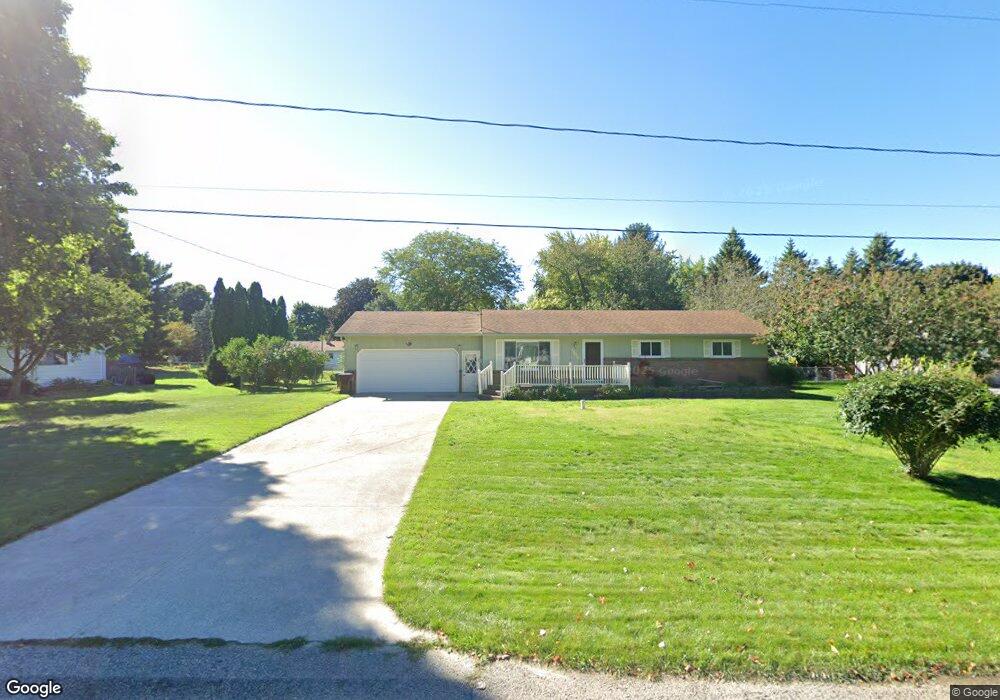
1600 Craig St Lansing, MI 48906
Estimated Value: $245,000 - $258,000
3
Beds
2
Baths
1,384
Sq Ft
$181/Sq Ft
Est. Value
About This Home
This home is located at 1600 Craig St, Lansing, MI 48906 and is currently estimated at $250,595, approximately $181 per square foot. 1600 Craig St is a home located in Clinton County with nearby schools including Gier Park School, Pattengill Academy, and Eastern Lansing High School.
Ownership History
Date
Name
Owned For
Owner Type
Purchase Details
Closed on
Feb 11, 2025
Sold by
Hayes Rebecca J
Bought by
Hayes Rebecca Jane and Rebecca Jane Hayes Revocable Living Trust
Current Estimated Value
Purchase Details
Closed on
Apr 30, 2008
Sold by
Federal National Mortgage Association
Bought by
Countrywide Home Loans Inc
Purchase Details
Closed on
Feb 22, 2008
Sold by
Mortgage Electronic Registration Systems
Bought by
Federal National Mortgage Association
Purchase Details
Closed on
Feb 21, 2008
Sold by
Etchison Joseph W and Biggin Dawn M
Bought by
Mortgage Electronic Registration Systems
Purchase Details
Closed on
May 12, 2004
Sold by
Rouse Mark S and Rouse Janet D
Bought by
Etchison Joseph W and Biggin Dawn M
Home Financials for this Owner
Home Financials are based on the most recent Mortgage that was taken out on this home.
Original Mortgage
$149,283
Interest Rate
5.99%
Mortgage Type
Purchase Money Mortgage
Create a Home Valuation Report for This Property
The Home Valuation Report is an in-depth analysis detailing your home's value as well as a comparison with similar homes in the area
Home Values in the Area
Average Home Value in this Area
Purchase History
| Date | Buyer | Sale Price | Title Company |
|---|---|---|---|
| Hayes Rebecca Jane | -- | None Listed On Document | |
| Countrywide Home Loans Inc | -- | None Available | |
| Federal National Mortgage Association | -- | None Available | |
| Mortgage Electronic Registration Systems | $128,250 | None Available | |
| Etchison Joseph W | $153,900 | -- |
Source: Public Records
Mortgage History
| Date | Status | Borrower | Loan Amount |
|---|---|---|---|
| Previous Owner | Etchison Joseph W | $149,283 |
Source: Public Records
Tax History Compared to Growth
Tax History
| Year | Tax Paid | Tax Assessment Tax Assessment Total Assessment is a certain percentage of the fair market value that is determined by local assessors to be the total taxable value of land and additions on the property. | Land | Improvement |
|---|---|---|---|---|
| 2025 | -- | $107,000 | $22,000 | $85,000 |
| 2024 | $1,503 | $99,900 | $20,600 | $79,300 |
| 2023 | $1,427 | $89,600 | $0 | $0 |
| 2022 | $2,087 | $80,100 | $18,300 | $61,800 |
| 2021 | $2,023 | $75,700 | $17,400 | $58,300 |
| 2020 | $2,004 | $71,600 | $16,400 | $55,200 |
| 2019 | $1,918 | $66,300 | $15,400 | $50,900 |
| 2018 | $1,677 | $63,100 | $15,000 | $48,100 |
| 2017 | $1,654 | $61,400 | $14,300 | $47,100 |
| 2016 | $1,638 | $58,200 | $13,500 | $44,700 |
| 2015 | $1,603 | $54,900 | $0 | $0 |
| 2011 | -- | $53,900 | $0 | $0 |
Source: Public Records
Map
Nearby Homes
- 15301 Boichot Rd
- 15480 Boichot Rd
- 15710 Oak Lane Dr
- 1404 W Stoll Rd
- 15860 Oak Lane Dr
- 15975 Northward Dr
- 106 Lancelot Place W Unit 28
- 14144 Ambrosia Ave
- 14031 Ambrosia Ave
- 500 Merlin Dr Unit 406
- The Spruce Plan at Thomas Farms - Leisure Series
- The Brinley Plan at Thomas Farms - Hometown Series
- 14054 Ambrosia Ave
- The Grayson Plan at Thomas Farms - Americana Series
- The Amber Plan at Thomas Farms - Hometown Series
- The Marley Plan at Thomas Farms - Americana Series
- The Sanibel Plan at Thomas Farms - Americana Series
- The Aspen Plan at Thomas Farms - Leisure Series
- The Stafford Plan at Thomas Farms - Hometown Series
- The Birch Plan at Thomas Farms - Leisure Series