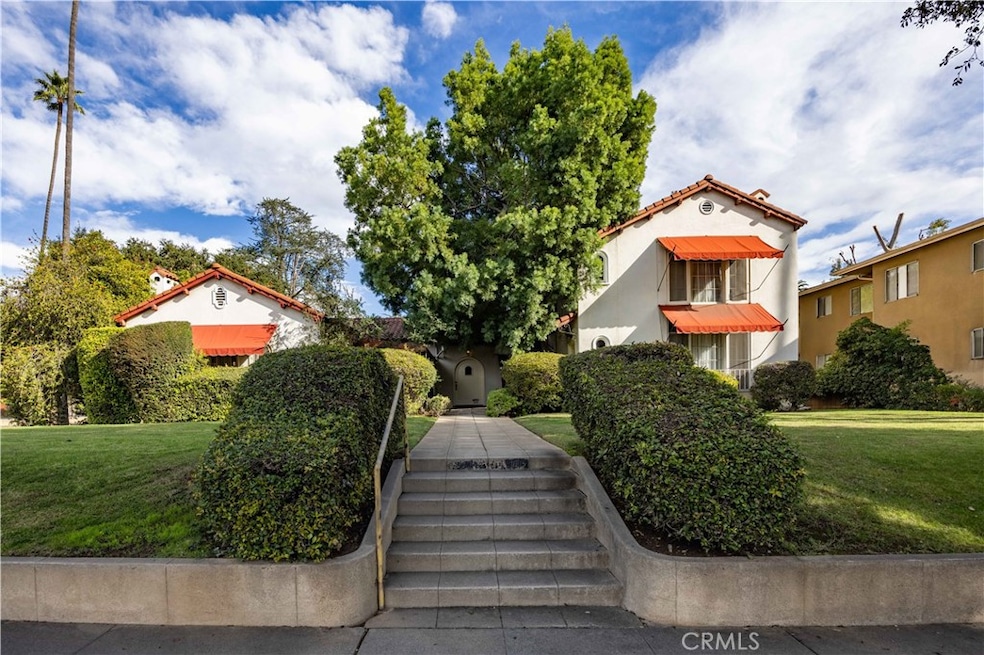
1600 Fair Oaks Ave South Pasadena, CA 91030
Estimated payment $12,343/month
Highlights
- End Unit
- No HOA
- Laundry Room
- Marengo Elementary Rated A+
About This Home
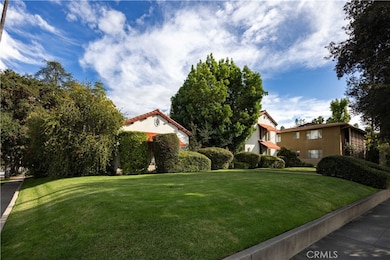
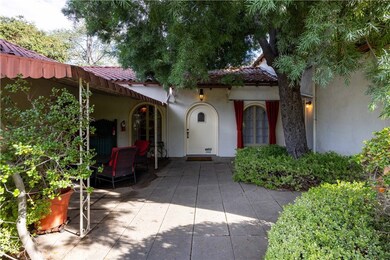
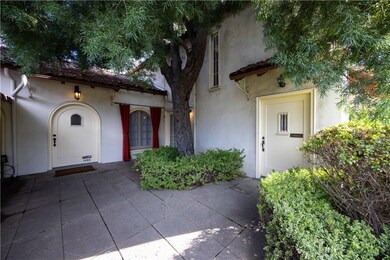
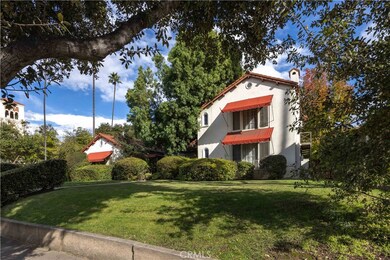
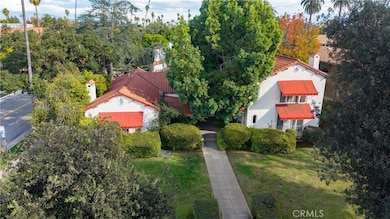
Prime investment opportunity in highly desirable South Pasadena! This well-maintained 4-unit multi-family property offers an ideal mix of unit types. The building features 3 spacious 1 bedroom / 1 bath units plus a larger 2-bedroom / 1 bath unit perfect for strong rental demand in this sought-after area.
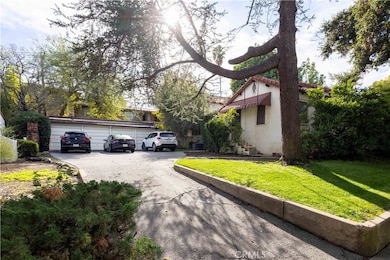
Appreciate the convenience of a 4-car garage along with additional parking in the long driveway. Located within walking distance to schools, local shops, restaurants and other neighborhood amenities. This property delivers unmatched location appeal. Don't miss your chance to own in one of the most coveted communities in the San Gabriel Valley!
Listing Agent
Spectrum Real Estate Group Brokerage Phone: 714-209-9889 License #01367574 Listed on: 11/26/2025
Property Details
Home Type
- Multi-Family
Est. Annual Taxes
- $3,370
Year Built
- Built in 1924
Lot Details
- 0.28 Acre Lot
- End Unit
- Two or More Common Walls
- Density is up to 1 Unit/Acre
Parking
- 4 Open Parking Spaces
- 4 Car Garage
Home Design
- Quadruplex
- Entry on the 1st floor
Interior Spaces
- 3,428 Sq Ft Home
- 2-Story Property
- Decorative Fireplace
- Laundry Room
Bedrooms and Bathrooms
- 5 Bedrooms
- 4 Bathrooms
Outdoor Features
- Exterior Lighting
Listing and Financial Details
- Tax Lot 16
- Tax Tract Number 480500
- Assessor Parcel Number 5320007020
- $3,500 per year additional tax assessments
Community Details
Overview
- No Home Owners Association
- 4 Units
Building Details
- 3 Leased Units
- 4 Separate Electric Meters
- 4 Separate Gas Meters
- 1 Separate Water Meter
- Insurance Expense $2,500
- Trash Expense $200
- Water Sewer Expense $400
- Operating Expense $600
- Gross Income $2,000
- Net Operating Income $3,000
Map
Home Values in the Area
Average Home Value in this Area
Tax History
| Year | Tax Paid | Tax Assessment Tax Assessment Total Assessment is a certain percentage of the fair market value that is determined by local assessors to be the total taxable value of land and additions on the property. | Land | Improvement |
|---|---|---|---|---|
| 2025 | $3,370 | $145,074 | $116,914 | $28,160 |
| 2024 | $3,370 | $142,230 | $114,622 | $27,608 |
| 2023 | $3,315 | $139,442 | $112,375 | $27,067 |
| 2022 | $3,256 | $136,709 | $110,172 | $26,537 |
| 2021 | $3,184 | $134,029 | $108,012 | $26,017 |
| 2020 | $3,143 | $132,656 | $106,905 | $25,751 |
| 2019 | $3,100 | $130,056 | $104,809 | $25,247 |
| 2018 | $7,670 | $535,814 | $429,242 | $106,572 |
| 2016 | $2,684 | $122,557 | $98,765 | $23,792 |
| 2015 | $2,639 | $120,717 | $97,282 | $23,435 |
| 2014 | $2,644 | $118,353 | $95,377 | $22,976 |
Property History
| Date | Event | Price | List to Sale | Price per Sq Ft |
|---|---|---|---|---|
| 11/26/2025 11/26/25 | For Sale | $2,299,999 | -- | $671 / Sq Ft |
Purchase History
| Date | Type | Sale Price | Title Company |
|---|---|---|---|
| Grant Deed | -- | None Listed On Document | |
| Gift Deed | -- | None Listed On Document | |
| Interfamily Deed Transfer | -- | Fnc Title Services Llc | |
| Interfamily Deed Transfer | -- | Placer Title Company | |
| Interfamily Deed Transfer | -- | Placer Title Company |
Mortgage History
| Date | Status | Loan Amount | Loan Type |
|---|---|---|---|
| Previous Owner | $2,782,500 | Reverse Mortgage Home Equity Conversion Mortgage | |
| Previous Owner | $938,250 | Reverse Mortgage Home Equity Conversion Mortgage |
Source: California Regional Multiple Listing Service (CRMLS)
MLS Number: PW25267047
APN: 5320-007-020
Disclaimer: Certain information contained herein is derived from information provided by parties other than Homes.com. All information provided is deemed reliable, but is not guaranteed to be accurate and should be independently verified.
![]() The multiple listing data appearing on this website, or contained in reports produced therefrom, is owned and copyrighted by California Regional Multiple Listing Service, Inc. ("CRMLS") and is protected by all applicable copyright laws. Information provided is for viewer's personal, non-commercial use and may not be used for any purpose other than to identify prospective properties the viewer may be interested in purchasing. All listing data, including but not limited to square footage and lot size is believed to be accurate, but the listing Agent, listing Broker and CRMLS and its affiliates do not warrant or guarantee such accuracy. The viewer should independently verify the listed data prior to making any decisions based on such information by personal inspection and/or contacting a real estate professional.
The multiple listing data appearing on this website, or contained in reports produced therefrom, is owned and copyrighted by California Regional Multiple Listing Service, Inc. ("CRMLS") and is protected by all applicable copyright laws. Information provided is for viewer's personal, non-commercial use and may not be used for any purpose other than to identify prospective properties the viewer may be interested in purchasing. All listing data, including but not limited to square footage and lot size is believed to be accurate, but the listing Agent, listing Broker and CRMLS and its affiliates do not warrant or guarantee such accuracy. The viewer should independently verify the listed data prior to making any decisions based on such information by personal inspection and/or contacting a real estate professional.
Based on information from California Regional Multiple Listing Service, Inc. and /or other sources. All data, including all measurements and calculations of area, is obtained from various sources and has not been, and will not be, verified by broker or MLS. All information should be independently reviewed and verified for accuracy. Properties may or may not be listed by the office/agent presenting the information
- 1715 Fair Oaks Ave Unit 15
- 1416 Oak St
- 1519 Spruce St
- 1625 Fremont Ave Unit A3
- 1519 Huntington Dr
- 1301 Spruce St
- 1810 Ramona Ave Unit 36
- 1218 Pine St
- 1257 Huntington Dr Unit A
- 1954 Primrose Ave
- 1120 Fremont Ave
- 1130 Pine St
- 868 Braewood Ct
- 838 Braewood Ct
- 1832 Bushnell Ave
- 2041 Ashbourne Dr
- 1720 Mission St Unit 7
- 1025 Mission St
- 910 N Bushnell Ave
- 2044 Monterey Rd
- 1801 Fair Oaks Ave Unit O
- 1612-1616 Huntington Dr
- 1628 Huntington Dr Unit 10
- 1218 Pine St
- 1208 Lyndon St
- 1109 Brent Ave
- 1711 Oxley St Unit F
- 1151 Pine St
- 1141 Pine St Unit 1
- 1141 Pine St Unit 6
- 1407 Meridian Ave
- 1104 Maple St
- 904 Monterey Rd
- 1700 Mission St Unit 18
- 2054 Fremont Ave
- 820 Brent Ave
- 1000 El Centro St
- 2800 W Alhambra Rd
- 312 La France Ave Unit 312B
- 1951 Alpha St
