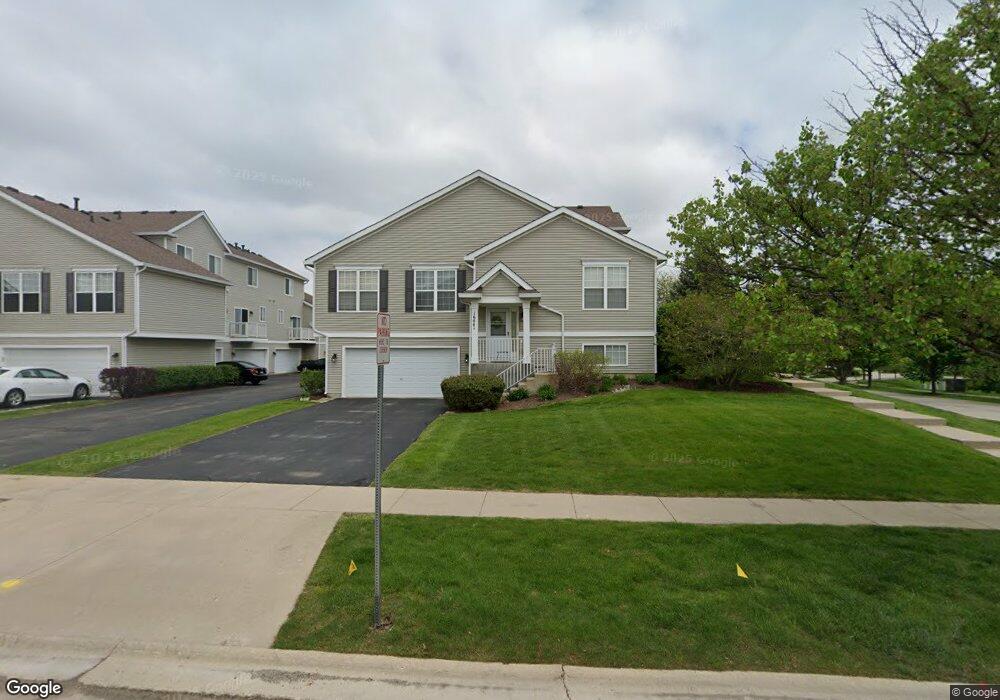
1600 Fieldstone Dr N Unit 601 Shorewood, IL 60404
Estimated Value: $275,000 - $300,000
3
Beds
2
Baths
1,700
Sq Ft
$168/Sq Ft
Est. Value
About This Home
This home is located at 1600 Fieldstone Dr N Unit 601, Shorewood, IL 60404 and is currently estimated at $286,037, approximately $168 per square foot. 1600 Fieldstone Dr N Unit 601 is a home located in Will County with nearby schools including Walnut Trails Elementary School, Minooka Junior High School, and Minooka Intermediate School.
Ownership History
Date
Name
Owned For
Owner Type
Purchase Details
Closed on
Nov 18, 2011
Sold by
Holland Toni
Bought by
Richied Joan M
Current Estimated Value
Purchase Details
Closed on
Jan 12, 2007
Sold by
Bridgeman Melissa K
Bought by
Holland Toni
Home Financials for this Owner
Home Financials are based on the most recent Mortgage that was taken out on this home.
Original Mortgage
$140,000
Interest Rate
5.75%
Mortgage Type
Purchase Money Mortgage
Purchase Details
Closed on
Jun 3, 2005
Sold by
Mccoy Farm Llc
Bought by
Bridgeman Melissa K
Home Financials for this Owner
Home Financials are based on the most recent Mortgage that was taken out on this home.
Original Mortgage
$146,400
Interest Rate
5.82%
Mortgage Type
Fannie Mae Freddie Mac
Create a Home Valuation Report for This Property
The Home Valuation Report is an in-depth analysis detailing your home's value as well as a comparison with similar homes in the area
Home Values in the Area
Average Home Value in this Area
Purchase History
| Date | Buyer | Sale Price | Title Company |
|---|---|---|---|
| Richied Joan M | $117,000 | Multiple | |
| Holland Toni | $189,000 | Ticor Title | |
| Bridgeman Melissa K | $183,000 | Lawyers |
Source: Public Records
Mortgage History
| Date | Status | Borrower | Loan Amount |
|---|---|---|---|
| Previous Owner | Holland Toni | $140,000 | |
| Previous Owner | Bridgeman Melissa K | $146,400 |
Source: Public Records
Tax History Compared to Growth
Tax History
| Year | Tax Paid | Tax Assessment Tax Assessment Total Assessment is a certain percentage of the fair market value that is determined by local assessors to be the total taxable value of land and additions on the property. | Land | Improvement |
|---|---|---|---|---|
| 2024 | $5,140 | $83,523 | $12,122 | $71,401 |
| 2023 | $5,140 | $75,043 | $10,891 | $64,152 |
| 2022 | $4,163 | $64,313 | $10,306 | $54,007 |
| 2021 | $3,031 | $60,501 | $9,695 | $50,806 |
| 2020 | $3,078 | $58,241 | $9,695 | $48,546 |
| 2019 | $3,154 | $55,867 | $9,300 | $46,567 |
| 2018 | $3,195 | $49,650 | $9,300 | $40,350 |
| 2017 | $3,078 | $47,731 | $9,300 | $38,431 |
| 2016 | $2,925 | $45,336 | $9,300 | $36,036 |
| 2015 | $2,440 | $42,868 | $8,218 | $34,650 |
| 2014 | $2,440 | $40,290 | $8,218 | $32,072 |
| 2013 | $2,440 | $40,290 | $8,218 | $32,072 |
Source: Public Records
Map
Nearby Homes
- 1713 Fieldstone Dr N
- 1632 Fieldstone Dr S Unit 2
- 1794 Fieldstone Dr N Unit 1794
- 1604 Augusta Ln
- 21037 Coventry Cir
- 0000 W Seil Rd
- 1018 Butterfield Cir E Unit 5
- 25226 Balmoral Dr
- 760 Pleasant Dr
- 709 Flag Dr
- 25102 Old Oak Ln
- 704 Flag Dr
- 636 Flag Dr
- 21059 Somerset St
- 21240 S Redwood Ln
- 621 Pleasant Dr
- 22020 S River Rd
- 24951 W Lake Forrest Ln
- 21246 Woodland Way
- 24755 W Manor Dr
- 1602 Fieldstone Dr N Unit 602
- 1604 Fieldstone Dr N Unit 603
- 1606 Fieldstone Dr N Unit 604
- 1618 Fieldstone Dr N Unit 606
- 1608 Fieldstone Dr N Unit 605
- 1616 Fieldstone Dr N Unit 607
- 1616 Fieldstone Dr N Unit 1616
- 1614 Fieldstone Dr N Unit 608
- 1614 Fieldstone Dr N Unit 1614
- 1612 Fieldstone Dr N Unit 609
- 1610 Fieldstone Dr N Unit 610
- 1605 Fieldstone Dr N Unit 714
- 1609 Fieldstone Dr N Unit 716
- 1609 Fieldstone Dr N
- 1607 Fieldstone Dr N Unit 715
- 1603 Fieldstone Dr N Unit 713
- 1603 Fieldstone Dr N Unit 1603
- 1611 Fieldstone Dr N Unit 717
- 1601 Fieldstone Dr N Unit 712
- 1633 Fieldstone Dr N