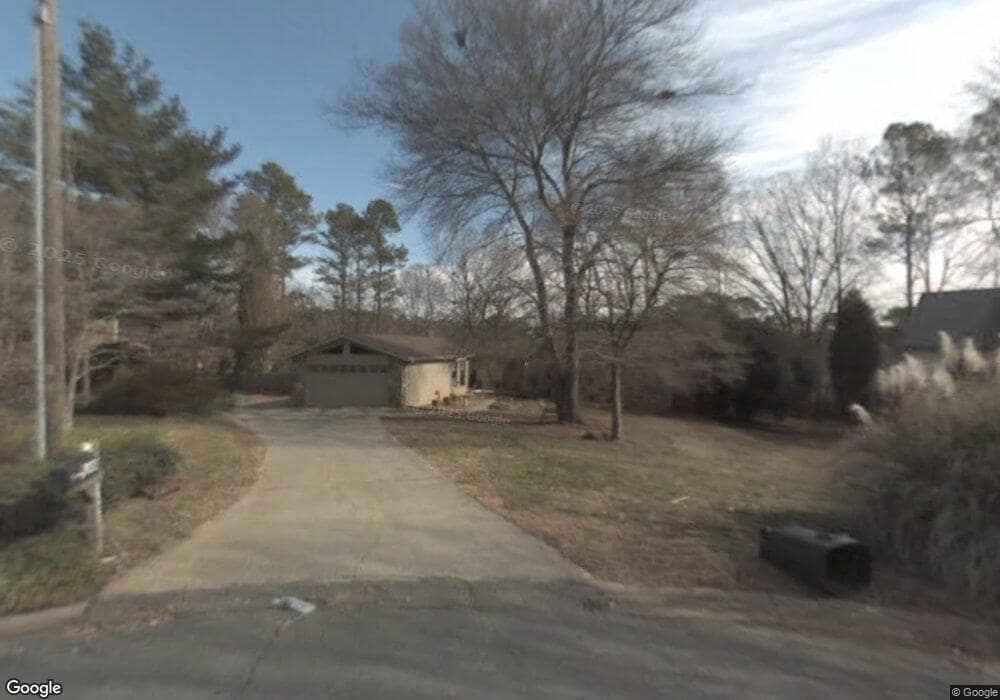
1600 Patricia Ct SE Smyrna, GA 30082
Estimated Value: $506,000 - $666,000
6
Beds
4
Baths
2,128
Sq Ft
$283/Sq Ft
Est. Value
About This Home
This home is located at 1600 Patricia Ct SE, Smyrna, GA 30082 and is currently estimated at $602,975, approximately $283 per square foot. 1600 Patricia Ct SE is a home located in Cobb County with nearby schools including King Springs Elementary School, Griffin Middle School, and Campbell High School.
Ownership History
Date
Name
Owned For
Owner Type
Purchase Details
Closed on
Jul 26, 2013
Sold by
Bueso Ines
Bought by
Diaz Fernando and Diaz Clementina B
Current Estimated Value
Purchase Details
Closed on
Mar 26, 2003
Sold by
Diaz Fernando and Diaz Clementina B
Bought by
Diaz Fernando
Purchase Details
Closed on
Aug 27, 2001
Sold by
Smith Will R and Smith Trudy M
Bought by
Diaz Clementina B
Home Financials for this Owner
Home Financials are based on the most recent Mortgage that was taken out on this home.
Original Mortgage
$138,000
Interest Rate
7.02%
Mortgage Type
New Conventional
Purchase Details
Closed on
Dec 4, 1995
Sold by
Spann Volesta B
Bought by
Smith Will R
Purchase Details
Closed on
Mar 19, 1993
Sold by
Styes Earl L
Bought by
Spann Volesta B
Home Financials for this Owner
Home Financials are based on the most recent Mortgage that was taken out on this home.
Original Mortgage
$140,894
Interest Rate
7.8%
Create a Home Valuation Report for This Property
The Home Valuation Report is an in-depth analysis detailing your home's value as well as a comparison with similar homes in the area
Home Values in the Area
Average Home Value in this Area
Purchase History
| Date | Buyer | Sale Price | Title Company |
|---|---|---|---|
| Diaz Fernando | -- | -- | |
| Diaz Fernando | -- | -- | |
| Diaz Clementina B | $228,000 | -- | |
| Smith Will R | $165,000 | -- | |
| Spann Volesta B | $154,000 | -- |
Source: Public Records
Mortgage History
| Date | Status | Borrower | Loan Amount |
|---|---|---|---|
| Previous Owner | Diaz Clementina B | $138,000 | |
| Previous Owner | Spann Volesta B | $140,894 | |
| Closed | Smith Will R | $0 |
Source: Public Records
Tax History Compared to Growth
Tax History
| Year | Tax Paid | Tax Assessment Tax Assessment Total Assessment is a certain percentage of the fair market value that is determined by local assessors to be the total taxable value of land and additions on the property. | Land | Improvement |
|---|---|---|---|---|
| 2025 | $705 | $227,076 | $44,000 | $183,076 |
| 2024 | $705 | $227,076 | $44,000 | $183,076 |
| 2023 | $553 | $227,076 | $44,000 | $183,076 |
| 2022 | $705 | $188,884 | $36,000 | $152,884 |
| 2021 | $724 | $145,588 | $36,000 | $109,588 |
| 2020 | $724 | $145,588 | $36,000 | $109,588 |
| 2019 | $3,892 | $141,572 | $36,000 | $105,572 |
| 2018 | $636 | $122,972 | $36,000 | $86,972 |
| 2017 | $507 | $95,276 | $28,000 | $67,276 |
| 2016 | $510 | $95,276 | $28,000 | $67,276 |
| 2015 | $553 | $95,276 | $28,000 | $67,276 |
| 2014 | $415 | $63,800 | $0 | $0 |
Source: Public Records
Map
Nearby Homes
- 1375 Mosswood Ln SE
- 4135 Fawn Ln SE
- 362 Doeskin Ln SE
- 4025 Benell Ct SE
- 203 Angla Dr SE
- 4195 Antler Trail SE
- 4246 Antler Trail SE
- 524 Tackett Farms Rd
- 3808 Concord Approach Way SE
- 418 Mockingbird Ln SE
- 317 Highview Dr SE
- 5020 Hickory Mill Dr SE
- 465 Willowbrook Dr SE
- 63 Geraldine Dr SE
- 14 Geraldine Dr SE
- 22 Geraldine Dr SE
- 18 Geraldine Dr SE
- 3910 W Cooper Lake Dr SE
- 22 Vanessa Dr SE Unit 8
- 576 N Thomas Ln SE
- 4080 Deerwood Pkwy SE
- 1595 Patricia Ct SE
- 1590 Patricia Ct SE
- 4090 Deerwood Pkwy SE
- 4070 Deerwood Pkwy SE
- 4100 Deerwood Pkwy SE
- 1585 Patricia Ct SE
- 140 Deerwood Cir SE
- 150 Deerwood Cir SE Unit 1
- 1580 Patricia Ct SE
- 1575 Patricia Ct SE
- 160 Deerwood Cir SE
- 4110 Deerwood Pkwy SE Unit 12
- 4110 Deerwood Pkwy SE
- 1455 Mosswood Ln SE
- 120 Deerwood Cir SE
- 120R Deerwood Cir SE
- 0 Deerwood Cir Unit 7365448
- 0 Deerwood Cir Unit 7539766
- 0 Deerwood Cir Unit 7405123