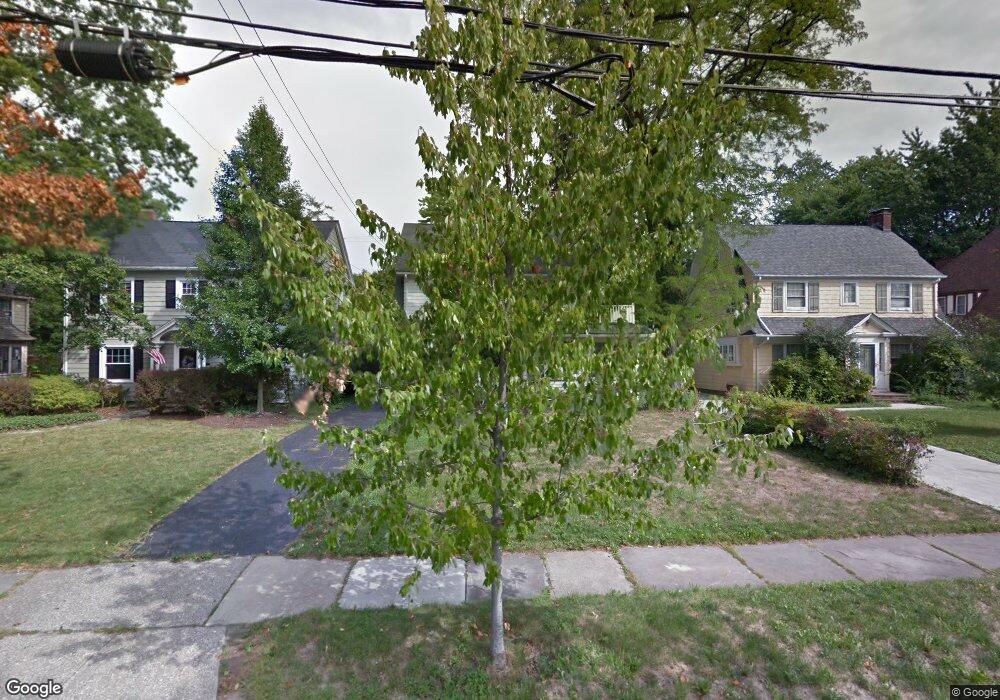
16001 Fernway Rd Cleveland, OH 44120
Estimated Value: $299,000 - $361,000
4
Beds
2
Baths
1,760
Sq Ft
$189/Sq Ft
Est. Value
About This Home
This home is located at 16001 Fernway Rd, Cleveland, OH 44120 and is currently estimated at $332,816, approximately $189 per square foot. 16001 Fernway Rd is a home located in Cuyahoga County with nearby schools including Onaway Elementary School, Woodbury Elementary School, and Shaker Heights Middle School.
Ownership History
Date
Name
Owned For
Owner Type
Purchase Details
Closed on
Oct 15, 2008
Sold by
Citimortgage Inc
Bought by
Stenson Ii William A
Current Estimated Value
Purchase Details
Closed on
Jul 13, 2007
Sold by
Saddler Ronald J
Bought by
Citimortgage Inc
Purchase Details
Closed on
Jun 2, 1999
Sold by
Haggins Edward T
Bought by
Saddler Ronald J
Home Financials for this Owner
Home Financials are based on the most recent Mortgage that was taken out on this home.
Original Mortgage
$135,000
Interest Rate
6.94%
Purchase Details
Closed on
Nov 3, 1989
Sold by
Haggins Edward T
Bought by
Haggins Zella M
Purchase Details
Closed on
Oct 23, 1989
Sold by
Arnwine Thaya M
Bought by
Haggins Edward T
Purchase Details
Closed on
Dec 24, 1987
Sold by
Arnwine Melvin and Arnwine Thaya
Bought by
Arnwine Thaya M
Purchase Details
Closed on
Jan 1, 1975
Bought by
Arnwine Melvin and Arnwine Thaya
Create a Home Valuation Report for This Property
The Home Valuation Report is an in-depth analysis detailing your home's value as well as a comparison with similar homes in the area
Home Values in the Area
Average Home Value in this Area
Purchase History
| Date | Buyer | Sale Price | Title Company |
|---|---|---|---|
| Stenson Ii William A | $76,000 | Resource Title Agency Inc | |
| Citimortgage Inc | $100,000 | Attorney | |
| Saddler Ronald J | $150,000 | -- | |
| Haggins Zella M | -- | -- | |
| Haggins Edward T | $65,000 | -- | |
| Arnwine Thaya M | -- | -- | |
| Arnwine Melvin | -- | -- |
Source: Public Records
Mortgage History
| Date | Status | Borrower | Loan Amount |
|---|---|---|---|
| Previous Owner | Saddler Ronald J | $135,000 |
Source: Public Records
Tax History Compared to Growth
Tax History
| Year | Tax Paid | Tax Assessment Tax Assessment Total Assessment is a certain percentage of the fair market value that is determined by local assessors to be the total taxable value of land and additions on the property. | Land | Improvement |
|---|---|---|---|---|
| 2024 | $8,283 | $90,615 | $22,505 | $68,110 |
| 2023 | $7,714 | $66,890 | $18,340 | $48,550 |
| 2022 | $7,506 | $66,890 | $18,340 | $48,550 |
| 2021 | $7,484 | $66,890 | $18,340 | $48,550 |
| 2020 | $7,432 | $62,510 | $17,150 | $45,360 |
| 2019 | $7,327 | $178,600 | $49,000 | $129,600 |
| 2018 | $6,896 | $62,510 | $17,150 | $45,360 |
| 2017 | $6,692 | $53,900 | $15,540 | $38,360 |
| 2016 | $6,431 | $53,900 | $15,540 | $38,360 |
| 2015 | $6,703 | $53,900 | $15,540 | $38,360 |
| 2014 | $6,703 | $52,710 | $14,140 | $38,570 |
Source: Public Records
Map
Nearby Homes
- 16005 Fernway Rd
- 3190 Warrington Rd
- 3283 Van Aken Blvd
- 3378 Clayton Blvd
- 16125 Parkland Dr
- 15610 Van Aken Blvd Unit 5
- 3380 Milverton Rd
- 3340 Milverton Rd
- 3180 Chadbourne Rd
- 16100 Van Aken Blvd
- 3298 Milverton Rd
- 17015 Fernway Rd
- 3264 E 149th St
- 3420 Westbury Rd
- 3077 Huntington Rd
- 3356 Daleford Rd
- 3261 E 147th St
- 2919 Sedgewick Rd
- 3340 E 149th St
- 14702 Milverton Rd
- 15915 Fernway Rd
- 15911 Fernway Rd
- 16011 Fernway Rd
- 15905 Fernway Rd
- 16015 Fernway Rd
- 15916 Aldersyde Dr
- 16004 Fernway Rd
- 15819 Fernway Rd
- 16101 Fernway Rd
- 16000 Aldersyde Dr
- 3261 Enderby Rd
- 15906 Aldersyde Dr
- 16010 Fernway Rd
- 15817 Fernway Rd
- 16105 Fernway Rd
- 3250 Aberdeen Rd
- 3265 Enderby Rd
- 16100 Aldersyde Dr
- 15850 Aldersyde Dr
- 15811 Fernway Rd