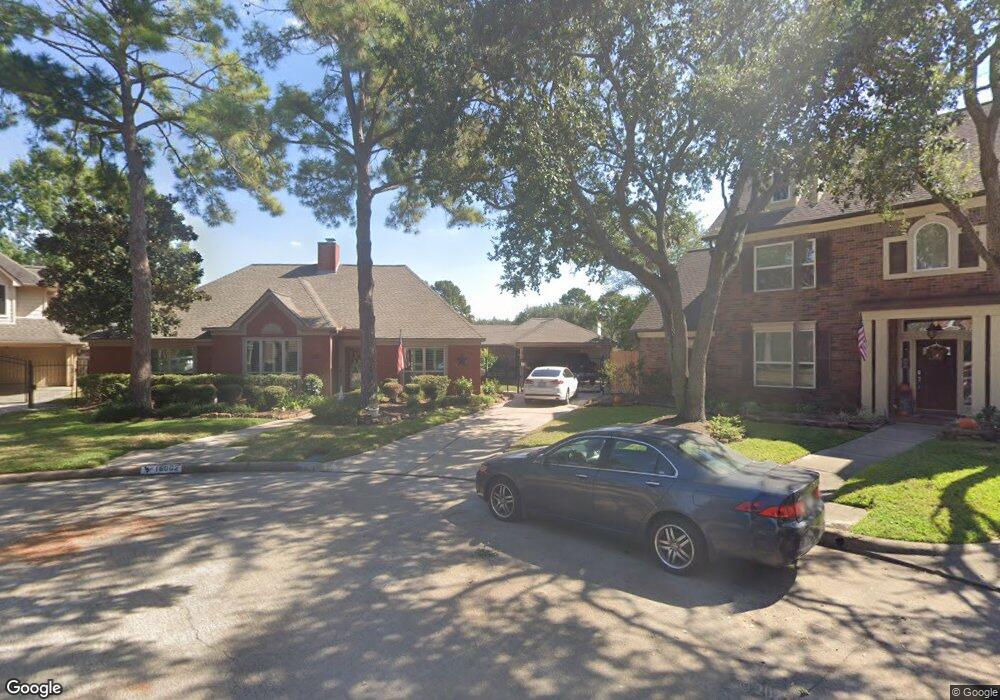
16002 Peach Bough Ln Houston, TX 77095
Copperfield NeighborhoodEstimated Value: $412,000 - $474,000
4
Beds
4
Baths
3,229
Sq Ft
$140/Sq Ft
Est. Value
About This Home
This home is located at 16002 Peach Bough Ln, Houston, TX 77095 and is currently estimated at $452,392, approximately $140 per square foot. 16002 Peach Bough Ln is a home located in Harris County with nearby schools including Lowery Elementary School, Aragon Middle School, and Langham Creek High School.
Ownership History
Date
Name
Owned For
Owner Type
Purchase Details
Closed on
Jun 14, 2022
Sold by
Healy Stebbins Herbert
Bought by
Stebbins Herbert Healy and Stebbins Kimberly T
Current Estimated Value
Purchase Details
Closed on
Aug 11, 2016
Sold by
Ann K Kampschmidt
Bought by
Stebbins Herbert
Home Financials for this Owner
Home Financials are based on the most recent Mortgage that was taken out on this home.
Original Mortgage
$293,040
Interest Rate
3.45%
Purchase Details
Closed on
Aug 1, 2003
Sold by
Choate David Brian and Choate Hollie Keyser
Bought by
Kampschmidt Kit and Kampschmidt Ann K
Home Financials for this Owner
Home Financials are based on the most recent Mortgage that was taken out on this home.
Original Mortgage
$200,000
Interest Rate
5.24%
Mortgage Type
Purchase Money Mortgage
Create a Home Valuation Report for This Property
The Home Valuation Report is an in-depth analysis detailing your home's value as well as a comparison with similar homes in the area
Home Values in the Area
Average Home Value in this Area
Purchase History
| Date | Buyer | Sale Price | Title Company |
|---|---|---|---|
| Stebbins Herbert Healy | $293,040 | None Listed On Document | |
| Stebbins Herbert | -- | -- | |
| Kampschmidt Kit | -- | Startex Title Company |
Source: Public Records
Mortgage History
| Date | Status | Borrower | Loan Amount |
|---|---|---|---|
| Previous Owner | Stebbins Herbert | $293,040 | |
| Previous Owner | Stebbins Herbert | -- | |
| Previous Owner | Kampschmidt Kit | $200,000 |
Source: Public Records
Tax History Compared to Growth
Tax History
| Year | Tax Paid | Tax Assessment Tax Assessment Total Assessment is a certain percentage of the fair market value that is determined by local assessors to be the total taxable value of land and additions on the property. | Land | Improvement |
|---|---|---|---|---|
| 2025 | $7,833 | $471,533 | $86,356 | $385,177 |
| 2024 | $7,833 | $478,853 | $78,290 | $400,563 |
| 2023 | $7,833 | $484,173 | $78,290 | $405,883 |
| 2022 | $9,314 | $449,796 | $52,193 | $397,603 |
| 2021 | $8,949 | $352,741 | $52,193 | $300,548 |
| 2020 | $9,055 | $345,981 | $40,331 | $305,650 |
| 2019 | $8,872 | $334,748 | $37,010 | $297,738 |
| 2018 | $3,077 | $298,368 | $37,010 | $261,358 |
| 2017 | $8,097 | $298,368 | $37,010 | $261,358 |
| 2016 | $8,097 | $298,368 | $37,010 | $261,358 |
| 2015 | $6,036 | $289,832 | $37,010 | $252,822 |
| 2014 | $6,036 | $276,293 | $37,010 | $239,283 |
Source: Public Records
Map
Nearby Homes
- 7511 Marble Glen Ln
- 16030 Royal Garden Dr
- 15810 Knoll Lake Dr
- 7419 Foxton Place Ct
- 7414 Starbridge Dr
- 7411 Marble Glen Ln
- 7403 Foxton Place Ct
- 15726 Echo Lodge Dr
- 15854 Knolls Lodge Dr
- 16346 Pebbleglen Dr
- 7318 Starbridge Dr
- 15914 Waybridge Glen Ln
- 7311 Postwick Ct
- 7719 Woodlett Ct
- 16502 Rainbow Lake Rd
- 16023 Gladebrook Glen Ln
- 16026 Autumn Falls Ln
- 7519 Sunlight Ln
- 16114 Kintyre Point Rd
- 7731 Club Lake Dr
- 16006 Peach Bough Ln
- 16003 Peach Bough Ln
- 16003 Ridge Park Dr
- 16007 Ridge Park Dr
- 16010 Peach Bough Ln
- 16011 Ridge Park Dr
- 16007 Peach Bough Ln
- 16011 Peach Bough Ln
- 16014 Peach Bough Ln
- 16015 Peach Bough Ln
- 16019 Peach Bough Ln
- 16103 Garden Hill Ln
- 16015 Garden Hill Ln
- 16107 Garden Hill Ln
- 16019 Ridge Park Dr
- 16011 Garden Hill Ln
- 16018 Peach Bough Ln
- 16111 Garden Hill Ln
- 16007 Garden Hill Ln
- 16003 Garden Hill Ln