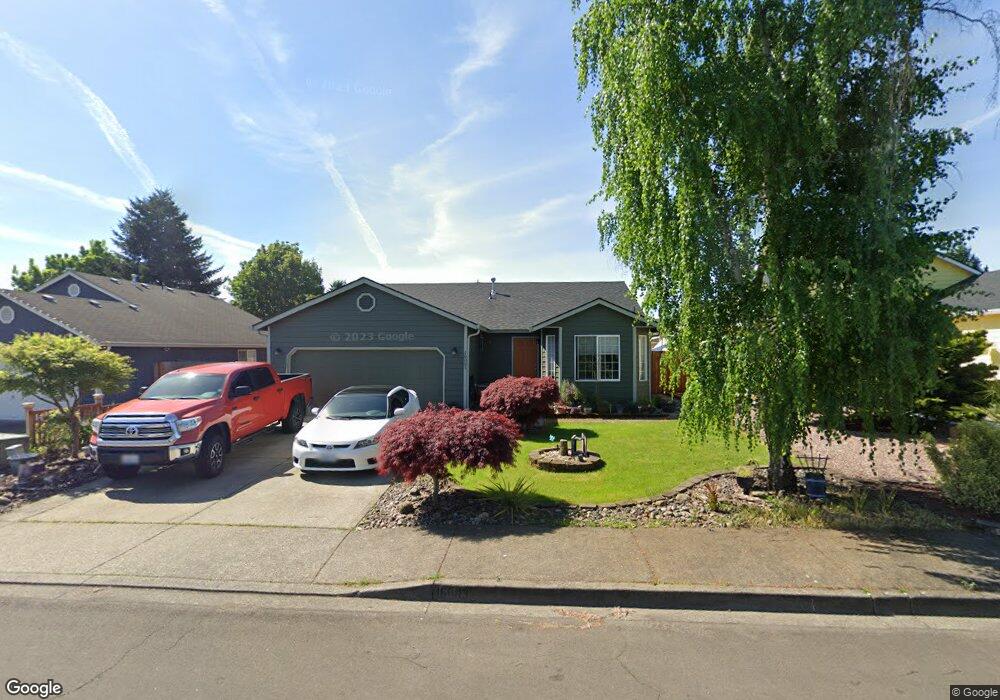
16003 NE 89th St Vancouver, WA 98682
Orchards Area NeighborhoodEstimated Value: $461,810 - $480,000
3
Beds
3
Baths
1,364
Sq Ft
$345/Sq Ft
Est. Value
About This Home
This home is located at 16003 NE 89th St, Vancouver, WA 98682 and is currently estimated at $469,953, approximately $344 per square foot. 16003 NE 89th St is a home located in Clark County with nearby schools including York Elementary School, Frontier Middle School, and Heritage High School.
Ownership History
Date
Name
Owned For
Owner Type
Purchase Details
Closed on
Feb 23, 2007
Sold by
Wagatsuma Miles
Bought by
Wagatsuma Miles and Wagatsuma Karolyn J
Current Estimated Value
Home Financials for this Owner
Home Financials are based on the most recent Mortgage that was taken out on this home.
Original Mortgage
$36,750
Outstanding Balance
$22,208
Interest Rate
6.23%
Mortgage Type
Stand Alone Second
Estimated Equity
$447,745
Purchase Details
Closed on
Nov 9, 2000
Sold by
Country Lane Acres Lp
Bought by
Wagatsuma Miles
Home Financials for this Owner
Home Financials are based on the most recent Mortgage that was taken out on this home.
Original Mortgage
$131,135
Interest Rate
7.88%
Mortgage Type
FHA
Purchase Details
Closed on
Nov 7, 2000
Sold by
Wagatsuma Karolyn
Bought by
Wagatsuma Miles
Home Financials for this Owner
Home Financials are based on the most recent Mortgage that was taken out on this home.
Original Mortgage
$131,135
Interest Rate
7.88%
Mortgage Type
FHA
Create a Home Valuation Report for This Property
The Home Valuation Report is an in-depth analysis detailing your home's value as well as a comparison with similar homes in the area
Home Values in the Area
Average Home Value in this Area
Purchase History
| Date | Buyer | Sale Price | Title Company |
|---|---|---|---|
| Wagatsuma Miles | -- | Stewart Title | |
| Wagatsuma Miles | $132,035 | Chicago Title Insurance Co | |
| Wagatsuma Miles | -- | Chicago Title Insurance |
Source: Public Records
Mortgage History
| Date | Status | Borrower | Loan Amount |
|---|---|---|---|
| Open | Wagatsuma Miles | $36,750 | |
| Open | Wagatsuma Miles | $196,000 | |
| Closed | Wagatsuma Miles | $131,135 |
Source: Public Records
Tax History Compared to Growth
Tax History
| Year | Tax Paid | Tax Assessment Tax Assessment Total Assessment is a certain percentage of the fair market value that is determined by local assessors to be the total taxable value of land and additions on the property. | Land | Improvement |
|---|---|---|---|---|
| 2025 | $4,066 | $404,278 | $180,900 | $223,378 |
| 2024 | $3,992 | $399,591 | $180,900 | $218,691 |
| 2023 | $3,986 | $412,335 | $180,900 | $231,435 |
| 2022 | $3,680 | $405,479 | $180,900 | $224,579 |
| 2021 | $3,392 | $348,611 | $155,601 | $193,010 |
| 2020 | $3,151 | $302,145 | $135,000 | $167,145 |
| 2019 | $2,863 | $281,590 | $123,750 | $157,840 |
| 2018 | $3,170 | $276,124 | $0 | $0 |
| 2017 | $2,756 | $246,849 | $0 | $0 |
| 2016 | $2,606 | $223,292 | $0 | $0 |
| 2015 | $2,492 | $196,490 | $0 | $0 |
| 2014 | -- | $178,777 | $0 | $0 |
| 2013 | -- | $167,707 | $0 | $0 |
Source: Public Records
Map
Nearby Homes
- 16001 NE 90th St
- 15813 NE 87th Cir
- 9008 NE 158th Ave
- 15520 NE 87th St
- 9214 NE 159th Ave
- 17309 NE 84th St
- 9203 NE 165th Ave
- 9017 NE Ward Rd
- 9115 NE 168th Ct
- 15107 NE 91st St
- 16705 NE 83rd St
- 9524 NE 166th Ave
- 9109 NE 151st Ct
- 15009 NE 91st St
- 16604 NE 80th St
- 8101 NE 167th Ave
- 14911 NE 86th St
- 15208 NE 96th St
- 7702 NE 159th Ave
- 9611 NE 152nd Ave
- 16007 NE 89th St
- 15921 NE 89th St
- 16011 NE 89th St
- 15917 NE 89th St
- 8707 NE 160th Ave
- 16002 NE 89th St
- 8712 NE 160th Ave
- 16015 NE 89th St Unit 1
- 16015 NE 89th St
- 16006 NE 89th St
- 15913 NE 89th St
- 15920 NE 89th St
- 8708 NE 161st Ave
- 16010 NE 89th St
- 15916 NE 89th St
- 8705 NE 160th Ave
- 8710 NE 160th Ave
- 8700 NE 161st Ave
- 16014 NE 89th St
- 15909 NE 89th St