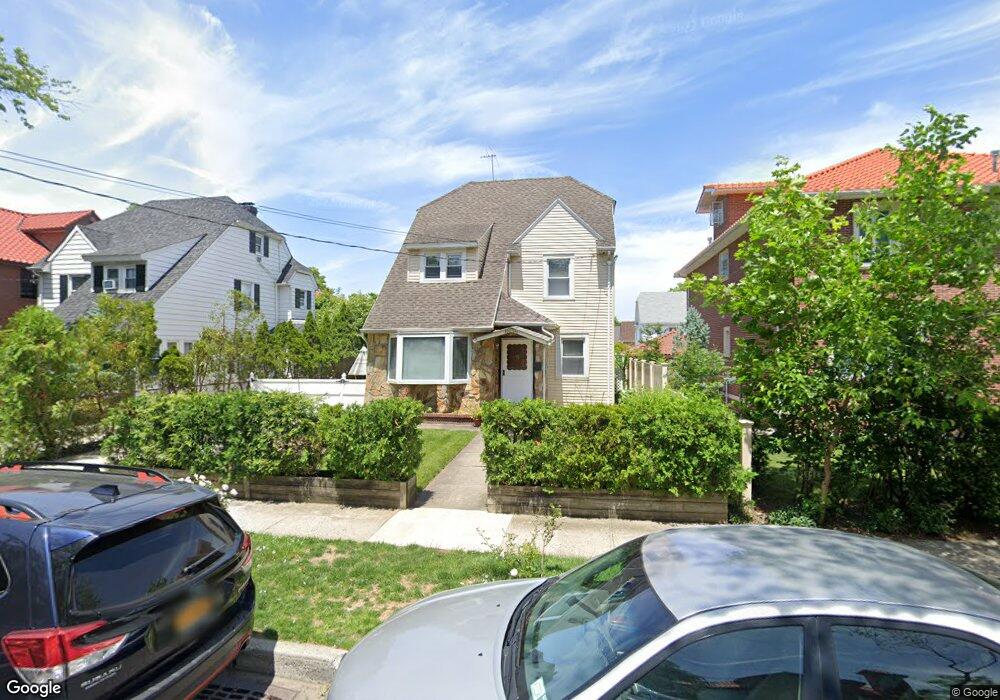
16009 32nd Ave Flushing, NY 11358
Murray Hill-Broadway NeighborhoodEstimated Value: $1,216,809 - $1,403,000
Studio
--
Bath
1,980
Sq Ft
$665/Sq Ft
Est. Value
About This Home
This home is located at 16009 32nd Ave, Flushing, NY 11358 and is currently estimated at $1,317,202, approximately $665 per square foot. 16009 32nd Ave is a home located in Queens County with nearby schools including P.S. 32 - State Street, I.S. 25 Adrien Block, and Francis Lewis High School.
Ownership History
Date
Name
Owned For
Owner Type
Purchase Details
Closed on
Mar 30, 1998
Sold by
Chang Yi Chuan and Chang Li Jung Cheng
Bought by
Patel Punita M and Patel Amita M
Current Estimated Value
Home Financials for this Owner
Home Financials are based on the most recent Mortgage that was taken out on this home.
Original Mortgage
$178,000
Interest Rate
7.05%
Create a Home Valuation Report for This Property
The Home Valuation Report is an in-depth analysis detailing your home's value as well as a comparison with similar homes in the area
Home Values in the Area
Average Home Value in this Area
Purchase History
| Date | Buyer | Sale Price | Title Company |
|---|---|---|---|
| Patel Punita M | $255,000 | Commonwealth Land Title Ins |
Source: Public Records
Mortgage History
| Date | Status | Borrower | Loan Amount |
|---|---|---|---|
| Previous Owner | Patel Punita M | $178,000 |
Source: Public Records
Tax History
| Year | Tax Paid | Tax Assessment Tax Assessment Total Assessment is a certain percentage of the fair market value that is determined by local assessors to be the total taxable value of land and additions on the property. | Land | Improvement |
|---|---|---|---|---|
| 2025 | $10,686 | $55,716 | $14,399 | $41,317 |
| 2024 | $10,698 | $54,605 | $15,180 | $39,425 |
| 2023 | $10,082 | $51,595 | $13,885 | $37,710 |
| 2022 | $9,458 | $71,340 | $20,700 | $50,640 |
| 2021 | $9,476 | $66,900 | $20,700 | $46,200 |
| 2020 | $9,532 | $63,840 | $20,700 | $43,140 |
| 2019 | $9,226 | $61,500 | $20,700 | $40,800 |
| 2018 | $8,467 | $42,996 | $14,263 | $28,733 |
| 2017 | $7,993 | $40,680 | $15,734 | $24,946 |
| 2016 | $7,426 | $40,680 | $15,734 | $24,946 |
| 2015 | $4,409 | $38,692 | $18,478 | $20,214 |
| 2014 | $4,409 | $37,920 | $20,171 | $17,749 |
Source: Public Records
Map
Nearby Homes
Your Personal Tour Guide
Ask me questions while you tour the home.