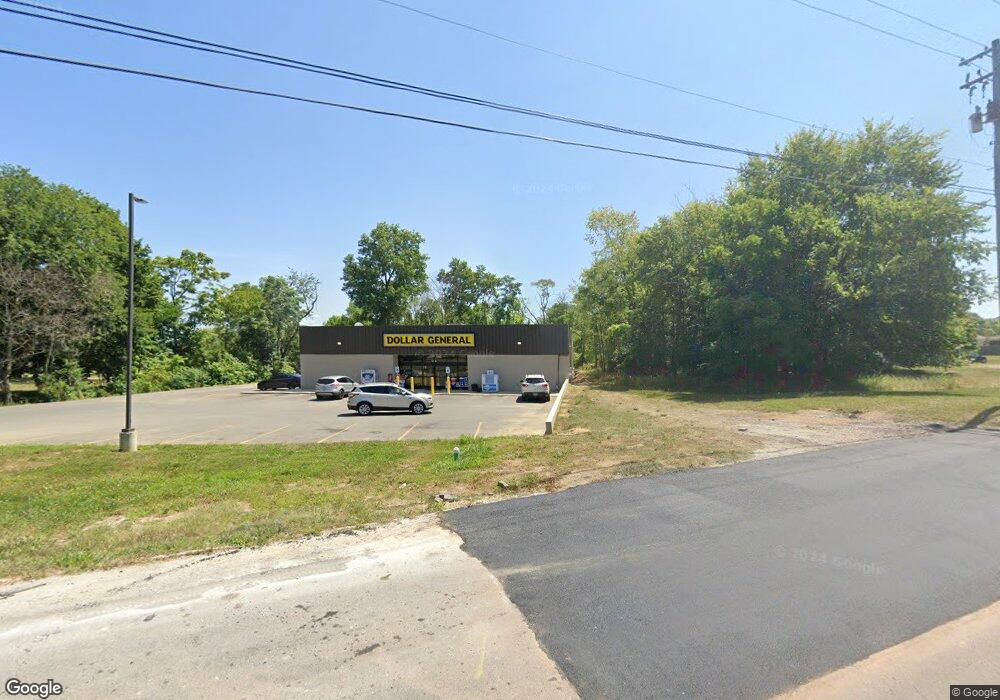
1601 Cottage St Ashland, OH 44805
Estimated Value: $1,410,000
Studio
3
Baths
6,417
Sq Ft
$220/Sq Ft
Est. Value
About This Home
This home is located at 1601 Cottage St, Ashland, OH 44805 and is currently estimated at $1,410,000, approximately $219 per square foot. 1601 Cottage St is a home located in Ashland County with nearby schools including Ashland High School, Ashland County Community Academy, and St. Edward Elementary School.
Ownership History
Date
Name
Owned For
Owner Type
Purchase Details
Closed on
May 2, 2023
Sold by
Msp Properties Of Ohio Lp
Bought by
Exchangeright Net-Leasedportfolio 63 Dst
Current Estimated Value
Purchase Details
Closed on
Jun 8, 2022
Sold by
Good Jeffrey P and Good Patricia A
Bought by
Msp Properties Of Ohio Lp
Home Financials for this Owner
Home Financials are based on the most recent Mortgage that was taken out on this home.
Original Mortgage
$1,120,000
Interest Rate
5.3%
Mortgage Type
New Conventional
Purchase Details
Closed on
Oct 28, 2016
Sold by
Sutton Bk
Bought by
Good Jeffrey P and Good Patricia A
Home Financials for this Owner
Home Financials are based on the most recent Mortgage that was taken out on this home.
Original Mortgage
$47,250
Interest Rate
3.48%
Mortgage Type
New Conventional
Purchase Details
Closed on
Jan 1, 1990
Create a Home Valuation Report for This Property
The Home Valuation Report is an in-depth analysis detailing your home's value as well as a comparison with similar homes in the area
Home Values in the Area
Average Home Value in this Area
Purchase History
| Date | Buyer | Sale Price | Title Company |
|---|---|---|---|
| Exchangeright Net-Leasedportfolio 63 Dst | $348,754,750 | Fidelity National Title | |
| Msp Properties Of Ohio Lp | -- | New Title Company Name | |
| Good Jeffrey P | $63,000 | Attorney Only | |
| -- | -- | -- |
Source: Public Records
Mortgage History
| Date | Status | Borrower | Loan Amount |
|---|---|---|---|
| Previous Owner | Msp Properties Of Ohio Lp | $1,120,000 | |
| Previous Owner | Good Jeffrey P | $47,250 |
Source: Public Records
Tax History
| Year | Tax Paid | Tax Assessment Tax Assessment Total Assessment is a certain percentage of the fair market value that is determined by local assessors to be the total taxable value of land and additions on the property. | Land | Improvement |
|---|---|---|---|---|
| 2025 | $34,026 | $568,750 | $8,870 | $559,880 |
| 2024 | $848 | $15,240 | $8,870 | $6,370 |
| 2023 | $848 | $15,240 | $8,870 | $6,370 |
| 2022 | $702 | $14,790 | $5,460 | $9,330 |
| 2021 | $2,620 | $44,170 | $6,830 | $37,340 |
| 2020 | $2,543 | $44,170 | $6,830 | $37,340 |
| 2019 | $1,713 | $28,380 | $6,830 | $21,550 |
| 2018 | $1,754 | $28,380 | $6,830 | $21,550 |
| 2017 | $1,791 | $28,380 | $6,830 | $21,550 |
| 2016 | $1,791 | $28,380 | $6,830 | $21,550 |
| 2015 | $1,801 | $28,380 | $6,830 | $21,550 |
| 2013 | $2,011 | $29,660 | $6,490 | $23,170 |
Source: Public Records
Map
Nearby Homes
- 1600 Cottage St
- 1602 Cottage St
- 1546 Cottage St
- 1542 Cottage St
- 1536 Cottage St
- 1701 Cottage St
- 1537 Short St
- 1611 Cottage St
- 1611 Cottage St
- 1527 Cottage St
- 1527 Cottage St
- 1527 Cottage St
- 505 W 18th St
- 1537 W 16th St
- 513 W 18th St
- 1704 Cottage St
- 1518 Cottage St
- 1522 Short St
- 345 Cottage St
- 0 Cottage St
Your Personal Tour Guide
Ask me questions while you tour the home.