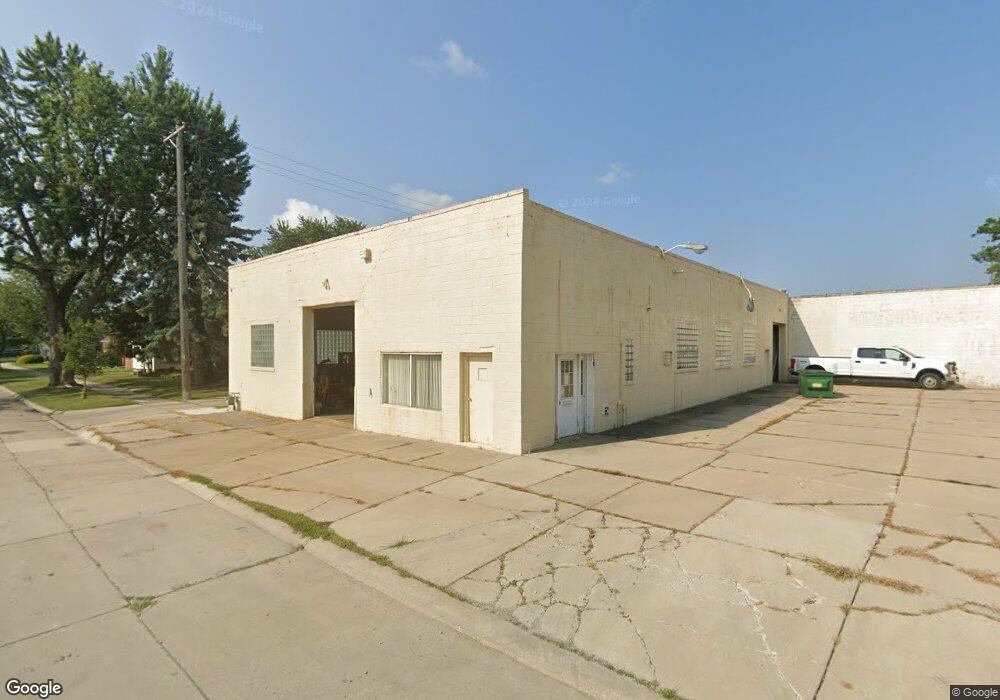
1601 Eureka Rd Wyandotte, MI 48192
Estimated Value: $320,060
--
Bed
1
Bath
4,100
Sq Ft
$78/Sq Ft
Est. Value
About This Home
This home is located at 1601 Eureka Rd, Wyandotte, MI 48192 and is currently estimated at $320,060, approximately $78 per square foot. 1601 Eureka Rd is a home located in Wayne County with nearby schools including Monroe Elementary School, Woodrow Wilson School, and Roosevelt High School.
Ownership History
Date
Name
Owned For
Owner Type
Purchase Details
Closed on
Aug 21, 2003
Sold by
Charter Bank
Bought by
Monroe Bank & Trust and Joseph S Daly Sep
Current Estimated Value
Purchase Details
Closed on
Sep 23, 2002
Sold by
City Of Wyandotte
Bought by
Paryaski Doreen A
Purchase Details
Closed on
Aug 1, 2002
Sold by
Dubke Mary V
Bought by
Chareter Bank
Purchase Details
Closed on
Jun 9, 1999
Sold by
Dubke Mary V
Bought by
Trust Mary V Dubke & Mary V Dubke Revocab
Purchase Details
Closed on
Dec 17, 1998
Sold by
Dubke Dubke J and Dubke C
Bought by
Dubke V
Create a Home Valuation Report for This Property
The Home Valuation Report is an in-depth analysis detailing your home's value as well as a comparison with similar homes in the area
Home Values in the Area
Average Home Value in this Area
Purchase History
| Date | Buyer | Sale Price | Title Company |
|---|---|---|---|
| Monroe Bank & Trust | -- | -- | |
| Paryaski Doreen A | -- | -- | |
| Chareter Bank | -- | -- | |
| Trust Mary V Dubke & Mary V Dubke Revocab | -- | -- | |
| Dubke V | $62,500 | -- |
Source: Public Records
Tax History Compared to Growth
Tax History
| Year | Tax Paid | Tax Assessment Tax Assessment Total Assessment is a certain percentage of the fair market value that is determined by local assessors to be the total taxable value of land and additions on the property. | Land | Improvement |
|---|---|---|---|---|
| 2025 | $4,376 | $109,900 | $0 | $0 |
| 2024 | $4,376 | $99,800 | $0 | $0 |
| 2023 | $4,173 | $92,500 | $0 | $0 |
| 2022 | $5,363 | $76,000 | $0 | $0 |
| 2021 | $5,240 | $72,300 | $0 | $0 |
| 2020 | $5,167 | $71,000 | $0 | $0 |
| 2019 | $5,139 | $70,400 | $0 | $0 |
| 2018 | $3,706 | $83,100 | $0 | $0 |
| 2017 | $2,573 | $83,100 | $0 | $0 |
| 2016 | $4,940 | $79,500 | $0 | $0 |
| 2015 | $6,650 | $82,000 | $0 | $0 |
| 2013 | $6,442 | $84,100 | $0 | $0 |
| 2012 | $3,069 | $80,900 | $30,200 | $50,700 |
Source: Public Records
Map
Nearby Homes