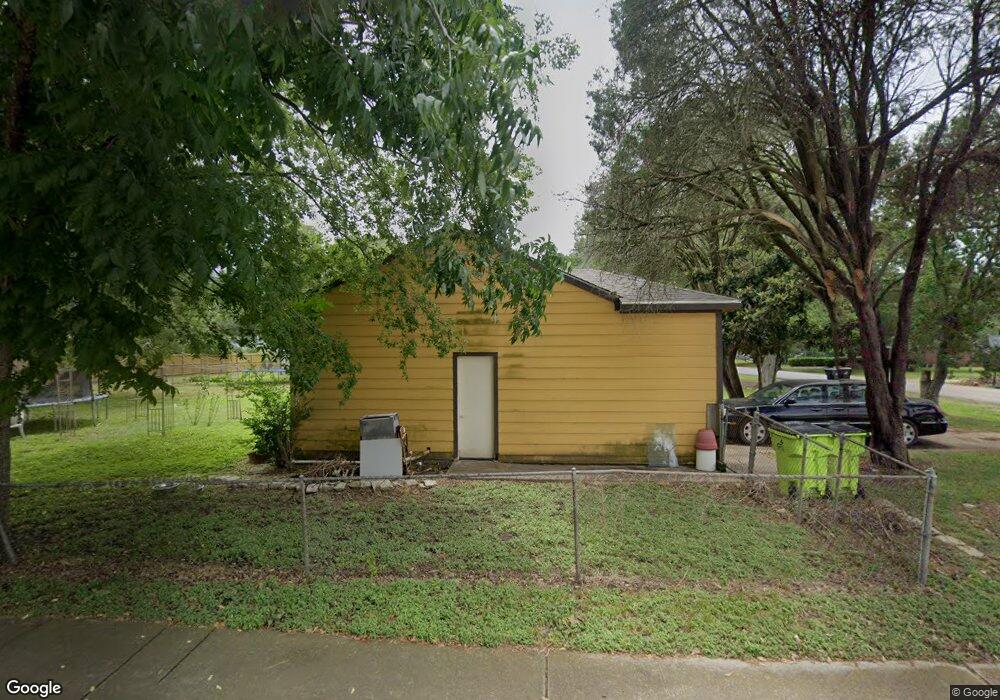
1601 Klauke St Rosenberg, TX 77471
Estimated Value: $169,784 - $196,000
1
Bed
1
Bath
1,103
Sq Ft
$167/Sq Ft
Est. Value
About This Home
This home is located at 1601 Klauke St, Rosenberg, TX 77471 and is currently estimated at $183,928, approximately $166 per square foot. 1601 Klauke St is a home located in Fort Bend County with nearby schools including Travis Elementary School, Navarro Middle School, and George Junior High School.
Ownership History
Date
Name
Owned For
Owner Type
Purchase Details
Closed on
Mar 19, 2002
Sold by
Grudziecke John W and Grudziecke Virginia G
Bought by
Sanchez Jamie and Sanchez Nora E
Current Estimated Value
Home Financials for this Owner
Home Financials are based on the most recent Mortgage that was taken out on this home.
Original Mortgage
$38,000
Interest Rate
6.83%
Purchase Details
Closed on
May 14, 1996
Sold by
Fisher Carolyn
Bought by
Grudziecke John W and Grudziecke Virginia G
Home Financials for this Owner
Home Financials are based on the most recent Mortgage that was taken out on this home.
Original Mortgage
$34,650
Interest Rate
7.74%
Purchase Details
Closed on
Oct 10, 1995
Sold by
Baranowski Clara H Syzdek and Walters Rosalie Baranowski
Bought by
Fisher Carolyn
Create a Home Valuation Report for This Property
The Home Valuation Report is an in-depth analysis detailing your home's value as well as a comparison with similar homes in the area
Home Values in the Area
Average Home Value in this Area
Purchase History
| Date | Buyer | Sale Price | Title Company |
|---|---|---|---|
| Sanchez Jamie | -- | American Title Co | |
| Grudziecke John W | -- | American Title Co | |
| Sanchez Jaime | -- | -- | |
| Fisher Carolyn | -- | American Title Company |
Source: Public Records
Mortgage History
| Date | Status | Borrower | Loan Amount |
|---|---|---|---|
| Closed | Sanchez Jamie | $38,000 | |
| Previous Owner | Sanchez Jaime | $34,650 |
Source: Public Records
Tax History Compared to Growth
Tax History
| Year | Tax Paid | Tax Assessment Tax Assessment Total Assessment is a certain percentage of the fair market value that is determined by local assessors to be the total taxable value of land and additions on the property. | Land | Improvement |
|---|---|---|---|---|
| 2025 | $3,276 | $145,180 | $24,000 | $121,180 |
| 2024 | $3,276 | $173,449 | $24,000 | $149,449 |
| 2023 | $3,379 | $175,013 | $24,000 | $151,013 |
| 2022 | $2,355 | $115,000 | $24,000 | $91,000 |
| 2021 | $2,367 | $114,070 | $24,000 | $90,070 |
| 2020 | $2,449 | $115,370 | $24,000 | $91,370 |
| 2019 | $2,273 | $99,510 | $24,000 | $75,510 |
| 2018 | $2,222 | $95,740 | $24,000 | $71,740 |
| 2017 | $2,178 | $93,310 | $24,000 | $69,310 |
| 2016 | $2,122 | $90,930 | $24,000 | $66,930 |
| 2015 | $2,065 | $88,010 | $24,000 | $64,010 |
| 2014 | $1,829 | $77,010 | $24,000 | $53,010 |
Source: Public Records
Map
Nearby Homes
- 1633 Jones St
- 1711 Klauke St
- 1803 Jones St
- 1733 Brumbelow St
- 1926 Klauke Ct
- 1816 Spruce Dr
- 1921 Ripple Creek Dr
- 4717 Woodway Ave
- 3608 Avenue R
- 4605 Greenwood Dr
- 4707 E Parma Dr
- 3433 Avenue P
- 2126 Ripple Creek Dr
- 3604 Rychlik Dr
- 1504 Radio Ln
- 1215 Lawrence St
- 0 Miles St
- 1317 Tobola St
- 1300 Lawrence St
- 2123 Moss Bluff Ln
- 1603 Klauke St
- 1600 Marilyn St
- 1605 Klauke St
- 1602 Marilyn St
- 1600 Klauke St
- 1602 Klauke St
- 1604 Marilyn St
- 1607 Klauke St
- 1604 Klauke St
- 1606 Marilyn St
- 1606 Klauke St
- 1525 Klauke St
- 1609 Klauke St
- 1601 Marilyn St
- 1601 Marilyn St
- 1603 Jones St
- 1603 Marilyn St
- 1609 Jones St
- 1608 Marilyn St
- 1605 Marilyn St