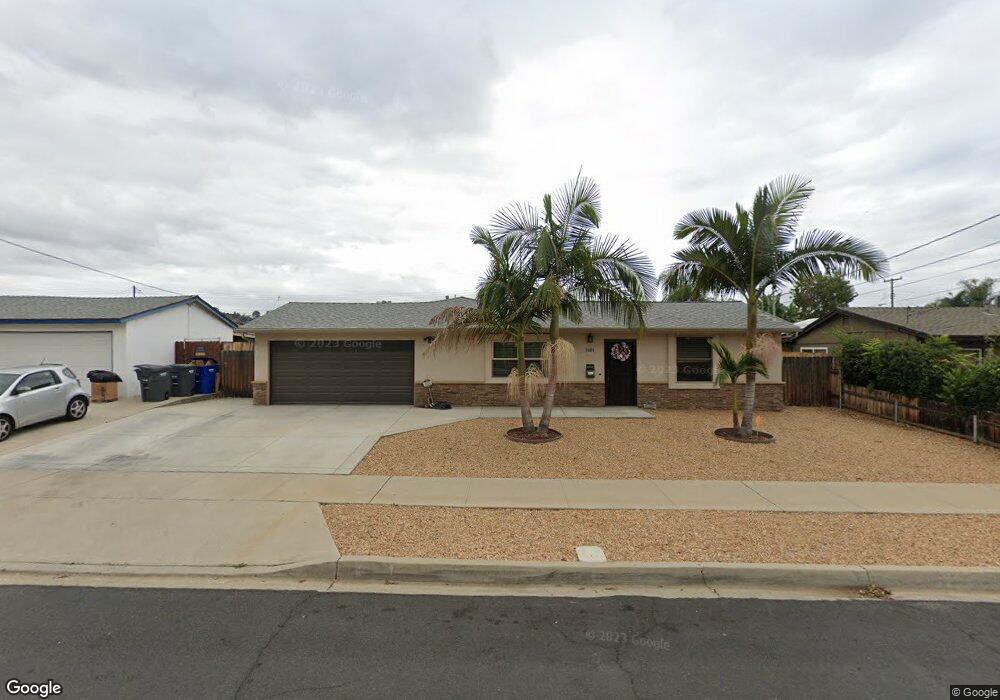
1601 Markerry Ave El Cajon, CA 92019
Estimated Value: $685,000 - $849,000
3
Beds
2
Baths
1,055
Sq Ft
$743/Sq Ft
Est. Value
About This Home
This home is located at 1601 Markerry Ave, El Cajon, CA 92019 and is currently estimated at $783,974, approximately $743 per square foot. 1601 Markerry Ave is a home located in San Diego County with nearby schools including Meridian Elementary School, Montgomery Middle School, and Granite Hills High School.
Ownership History
Date
Name
Owned For
Owner Type
Purchase Details
Closed on
Nov 2, 2016
Sold by
Hughes Rob and Hughes Shirlee
Bought by
Vanbrocklin Ii Gaylord and Vanbrocklin Patti A
Current Estimated Value
Home Financials for this Owner
Home Financials are based on the most recent Mortgage that was taken out on this home.
Original Mortgage
$392,755
Interest Rate
3.62%
Mortgage Type
FHA
Purchase Details
Closed on
Feb 3, 2009
Sold by
Wygant Michael John and Wygant Melinda Jean
Bought by
Hughes Rob and Hughes Shirlee
Purchase Details
Closed on
Dec 16, 1993
Sold by
Knaak Betty Lou
Bought by
Wygant Michael John and Wygant Melinda Jean
Home Financials for this Owner
Home Financials are based on the most recent Mortgage that was taken out on this home.
Original Mortgage
$142,698
Interest Rate
7.16%
Mortgage Type
VA
Create a Home Valuation Report for This Property
The Home Valuation Report is an in-depth analysis detailing your home's value as well as a comparison with similar homes in the area
Purchase History
| Date | Buyer | Sale Price | Title Company |
|---|---|---|---|
| Vanbrocklin Ii Gaylord | $400,000 | First American Title | |
| Hughes Rob | $200,000 | First American Title San Die | |
| Wygant Michael John | $140,000 | Fidelity National Title |
Source: Public Records
Mortgage History
| Date | Status | Borrower | Loan Amount |
|---|---|---|---|
| Previous Owner | Vanbrocklin Ii Gaylord | $392,755 | |
| Previous Owner | Wygant Michael John | $142,698 |
Source: Public Records
Tax History
| Year | Tax Paid | Tax Assessment Tax Assessment Total Assessment is a certain percentage of the fair market value that is determined by local assessors to be the total taxable value of land and additions on the property. | Land | Improvement |
|---|---|---|---|---|
| 2025 | $5,910 | $464,226 | $189,852 | $274,374 |
| 2024 | $5,910 | $455,125 | $186,130 | $268,995 |
| 2023 | $5,787 | $446,202 | $182,481 | $263,721 |
| 2022 | $5,678 | $437,453 | $178,903 | $258,550 |
| 2021 | $5,571 | $428,877 | $175,396 | $253,481 |
| 2020 | $5,419 | $424,480 | $173,598 | $250,882 |
| 2019 | $5,012 | $416,158 | $170,195 | $245,963 |
| 2018 | $4,929 | $407,999 | $166,858 | $241,141 |
| 2017 | $31 | $298,437 | $122,051 | $176,386 |
| 2016 | $3,556 | $292,586 | $119,658 | $172,928 |
| 2015 | $3,539 | $288,192 | $117,861 | $170,331 |
| 2014 | $2,591 | $210,096 | $115,553 | $94,543 |
Source: Public Records
Map
Nearby Homes
- 1634 Doncarol Ave
- 1479 E Lexington Ave
- 1494 Dumar Ave
- 567 Brighthaven Ave
- 133 N Stephanie Ln
- 1509 E Washington Ave Unit 27
- 1319 Yannis Ct
- 1307 Yannis Ct
- 739 Mahogany Dr
- 1518 Granite Hills Dr Unit A
- 1508 Granite Hills Dr Unit E
- 1504 Granite Hills Dr Unit A
- 120 Landale Ln
- 1571 Granite Hills Dr
- 1573 E Madison Ave
- 514 Jamacha Rd Unit 2J
- 1322 Cantada Ct
- 1318 Cantada Ct
- 1305 Yannis Ct
- 1306 Cantada Ct
- 1607 Markerry Ave
- 1599 Markerry Ave
- 1600 Norran Ave
- 1598 Norran Ave
- 1610 Norran Ave
- 1611 Markerry Ave
- 1593 Markerry Ave
- 1602 Markerry Ave
- 1590 Norran Ave
- 1620 Norran Ave
- 1598 Markerry Ave
- 1608 Markerry Ave
- 1619 Markerry Ave
- 1590 Markerry Ave
- 1612 Markerry Ave
- 1579 Markerry Ave
- 1626 Norran Ave
- 1588 Norran Ave
- 1603 E Lexington Ave
- 1599 Norran Ave
Your Personal Tour Guide
Ask me questions while you tour the home.