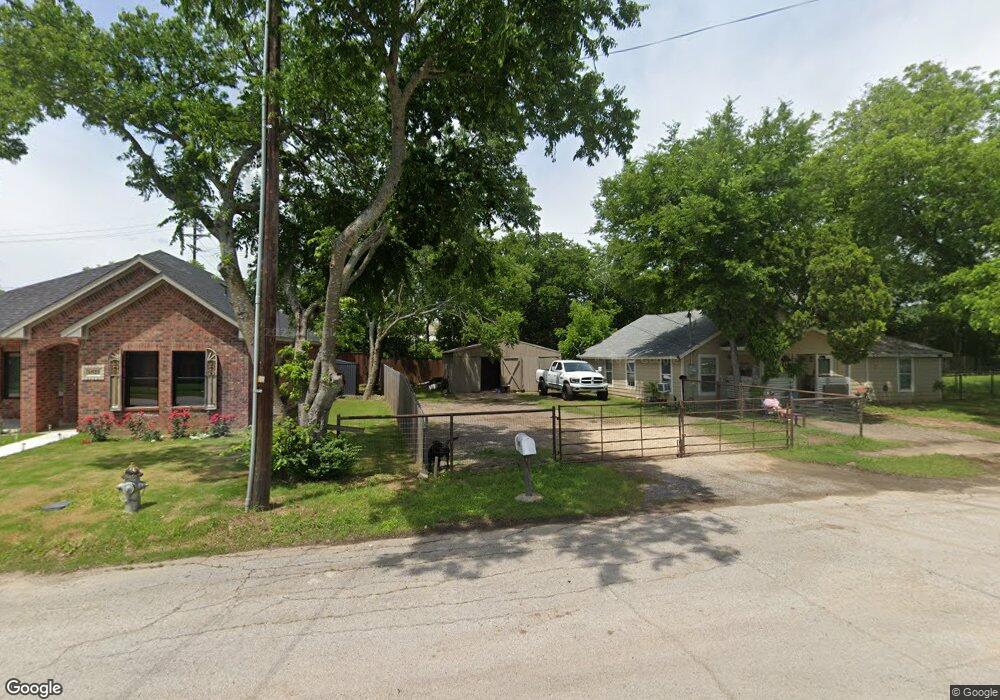
1601 N Brazos Ave Cleburne, TX 76031
Estimated Value: $190,000 - $251,000
3
Beds
2
Baths
1,476
Sq Ft
$147/Sq Ft
Est. Value
About This Home
This home is located at 1601 N Brazos Ave, Cleburne, TX 76031 and is currently estimated at $217,678, approximately $147 per square foot. 1601 N Brazos Ave is a home located in Johnson County with nearby schools including Santa Fe Elementary School, Lowell Smith Jr. Middle School, and Cleburne High School.
Ownership History
Date
Name
Owned For
Owner Type
Purchase Details
Closed on
Oct 25, 2017
Sold by
Ska Properties Llc
Bought by
Sanchez Ceasar
Current Estimated Value
Purchase Details
Closed on
Oct 14, 2017
Sold by
Fuller Glenn E and Fuller James H
Bought by
Ska Proepties Llc
Purchase Details
Closed on
Nov 14, 2013
Sold by
Deutsche Bank National Trust Co
Bought by
Z L Builders
Purchase Details
Closed on
Apr 14, 2013
Sold by
Fuller Oscar R
Bought by
Deutsche Bank National Trust Co and Long Beach Mortgage Loan Trust 2006-4
Purchase Details
Closed on
Jul 1, 2008
Sold by
Bosher Jeremy
Bought by
Bosher Kim
Purchase Details
Closed on
Mar 24, 2006
Sold by
Fuller Oscar E and Fuller Mae R
Bought by
Fuller Oscar R
Home Financials for this Owner
Home Financials are based on the most recent Mortgage that was taken out on this home.
Original Mortgage
$40,050
Interest Rate
6.21%
Mortgage Type
New Conventional
Create a Home Valuation Report for This Property
The Home Valuation Report is an in-depth analysis detailing your home's value as well as a comparison with similar homes in the area
Home Values in the Area
Average Home Value in this Area
Purchase History
| Date | Buyer | Sale Price | Title Company |
|---|---|---|---|
| Sanchez Ceasar | -- | None Available | |
| Ska Proepties Llc | -- | None Available | |
| Z L Builders | -- | None Available | |
| Deutsche Bank National Trust Co | $33,587 | None Available | |
| Bosher Kim | -- | None Available | |
| Fuller Oscar R | -- | None Available |
Source: Public Records
Mortgage History
| Date | Status | Borrower | Loan Amount |
|---|---|---|---|
| Previous Owner | Fuller Oscar R | $40,050 |
Source: Public Records
Tax History Compared to Growth
Tax History
| Year | Tax Paid | Tax Assessment Tax Assessment Total Assessment is a certain percentage of the fair market value that is determined by local assessors to be the total taxable value of land and additions on the property. | Land | Improvement |
|---|---|---|---|---|
| 2025 | $2,377 | $108,354 | $43,000 | $65,354 |
| 2024 | $2,377 | $106,625 | $0 | $0 |
| 2023 | $1,977 | $88,854 | $23,500 | $65,354 |
| 2022 | $2,224 | $88,854 | $23,500 | $65,354 |
| 2021 | $2,318 | $88,854 | $23,500 | $65,354 |
| 2020 | $1,567 | $56,532 | $20,000 | $36,532 |
| 2019 | $1,670 | $56,532 | $20,000 | $36,532 |
| 2018 | $418 | $14,153 | $10,500 | $3,653 |
| 2017 | $417 | $14,153 | $10,500 | $3,653 |
| 2016 | $417 | $14,153 | $10,500 | $3,653 |
| 2015 | $364 | $14,153 | $10,500 | $3,653 |
| 2014 | $364 | $13,653 | $10,000 | $3,653 |
Source: Public Records
Map
Nearby Homes
- 1609 N Brazos Ave
- 1014 Trinity St
- 1308 N Brazos Ave
- 1300 N Brazos Ave
- 438 Sabine Ave
- 806 Barber Ave
- 1103 Chase Ave
- 301 Eastland St
- 741 N Robinson St
- 735 N Robinson St
- 709 N Wilhite St Unit 711
- 622 Mansfield Rd
- 604 Crockett Dr
- 612 Crockett Dr
- 616 Crockett Dr
- 1205 Boone St
- 105 E Lone Star Ave
- 621 Crockett Dr
- 614 N Robinson St
- 222 Cleveland St
- 1521 N Brazos Ave
- 1523 N Brazos Ave
- 1602 N Brazos Ave
- 103 Austin Ave
- 1519 N Brazos Ave
- 105 Austin Ave
- 1518 N Brazos Ave
- 1513 N Brazos Ave
- 107 Austin Ave
- 305 Morgan St
- 103 Morgan St
- 883 Sabine Ave
- 885 Sabine Ave
- 887 Sabine Ave
- 611 Sabine Ave
- 889 Sabine Ave
- 309 Morgan St
- 609 Sabine Ave
- 607 Sabine Ave
- TBD Sabine Ave