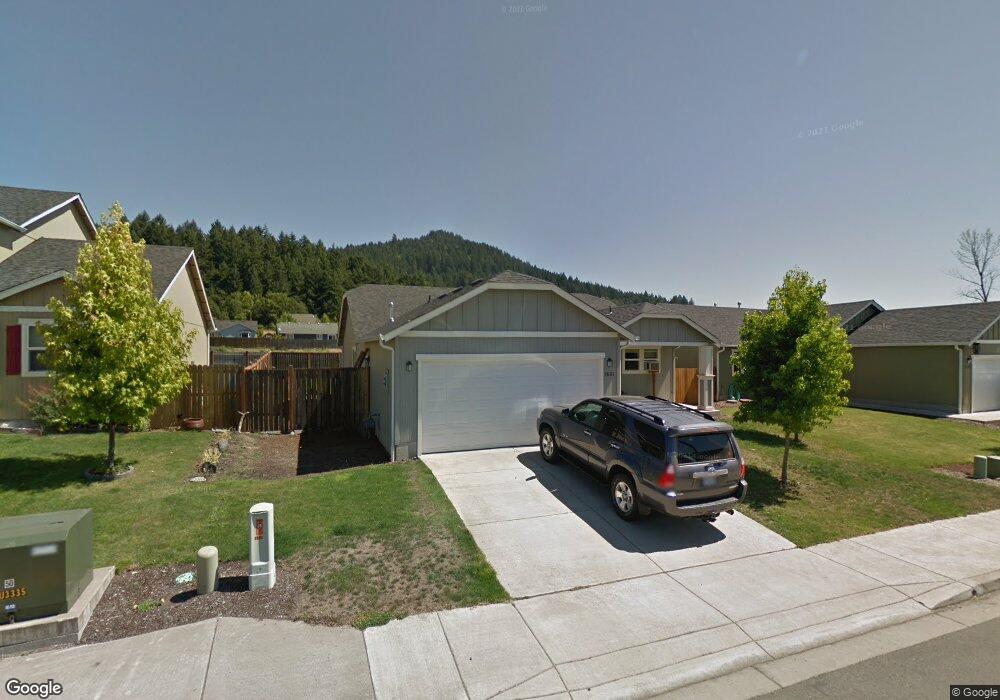
1601 S 58th St Springfield, OR 97478
East Springfield NeighborhoodEstimated Value: $385,667 - $420,000
3
Beds
2
Baths
1,242
Sq Ft
$327/Sq Ft
Est. Value
About This Home
This home is located at 1601 S 58th St, Springfield, OR 97478 and is currently estimated at $405,917, approximately $326 per square foot. 1601 S 58th St is a home located in Lane County with nearby schools including Riverbend Elementary School, Agnes Stewart Middle School, and Thurston High School.
Ownership History
Date
Name
Owned For
Owner Type
Purchase Details
Closed on
Apr 17, 2015
Sold by
Wylie Peterson Cheryl A
Bought by
Wylie Peterson Cheryl A and The Cheryl L Wylie Peterson Living Trust
Current Estimated Value
Home Financials for this Owner
Home Financials are based on the most recent Mortgage that was taken out on this home.
Original Mortgage
$70,000
Outstanding Balance
$53,653
Interest Rate
3.7%
Mortgage Type
New Conventional
Estimated Equity
$352,264
Purchase Details
Closed on
Apr 16, 2015
Sold by
Hlm Inc
Bought by
Wylie Peterson Cheryl A
Home Financials for this Owner
Home Financials are based on the most recent Mortgage that was taken out on this home.
Original Mortgage
$70,000
Outstanding Balance
$53,653
Interest Rate
3.7%
Mortgage Type
New Conventional
Estimated Equity
$352,264
Purchase Details
Closed on
Aug 4, 2008
Sold by
Watson Development Ltd
Bought by
Hlm Inc
Purchase Details
Closed on
May 29, 2008
Sold by
Hayden Homes Llc
Bought by
Watson Development Ltd
Create a Home Valuation Report for This Property
The Home Valuation Report is an in-depth analysis detailing your home's value as well as a comparison with similar homes in the area
Home Values in the Area
Average Home Value in this Area
Purchase History
| Date | Buyer | Sale Price | Title Company |
|---|---|---|---|
| Wylie Peterson Cheryl A | -- | Cascade Title Company | |
| Wylie Peterson Cheryl A | $181,890 | Cascade Title Company | |
| Hlm Inc | -- | Cascade Title Co | |
| Watson Development Ltd | $150,000 | Cascade Title Co |
Source: Public Records
Mortgage History
| Date | Status | Borrower | Loan Amount |
|---|---|---|---|
| Open | Wylie Peterson Cheryl A | $70,000 |
Source: Public Records
Tax History Compared to Growth
Tax History
| Year | Tax Paid | Tax Assessment Tax Assessment Total Assessment is a certain percentage of the fair market value that is determined by local assessors to be the total taxable value of land and additions on the property. | Land | Improvement |
|---|---|---|---|---|
| 2025 | $3,619 | $197,380 | -- | -- |
| 2024 | $3,561 | $191,632 | -- | -- |
| 2023 | $3,561 | $186,051 | $0 | $0 |
| 2022 | $3,298 | $180,633 | $0 | $0 |
| 2021 | $3,239 | $175,372 | $0 | $0 |
| 2020 | $3,144 | $170,265 | $0 | $0 |
| 2019 | $3,050 | $165,306 | $0 | $0 |
| 2018 | $2,875 | $155,817 | $0 | $0 |
| 2017 | $2,764 | $155,817 | $0 | $0 |
| 2016 | $2,706 | $151,279 | $0 | $0 |
| 2015 | $2,629 | $146,873 | $0 | $0 |
| 2014 | -- | $142,595 | $0 | $0 |
Source: Public Records
Map
Nearby Homes
- 1839 S 57th St
- 6195 Graystone Loop
- 0 Forsythia St
- 6225 Forest Ridge Dr
- 5289 Cedar View Dr
- 6035 Fernhill Loop
- 967 S 66th Place
- 0 Forest Ridge Dr Unit 637211360
- 0 Forest Ridge Dr Unit 298125461
- 0 Forest Ridge Dr Unit 415181610
- 5335 Daisy St Unit TL 0130
- 5204 Cedar View Dr
- 5198 Cedar View Dr
- 5292 Squirrel St
- 5335 Main St Unit 236
- 0 Forest Ridge Unit 520732026
- 5193 Holly St
- 5207 Holly St
- 5123 Holly St
- 5137 Holly St
- 1633 S 58th Lot 217 Place
- 1633 S 58th St
- 1655 S 58th St
- 5793 Cinder St
- 1581 S 58th St
- 5794 Cinder St
- 5787 Cinder St
- 1679 S 58th St
- 1547 S 58th St
- 5786 Cinder St
- 1707 S 58th St
- 1525 S 58th St
- 5799 Peridot Way
- 5781 Cinder St
- 5782 Obsidian Ave
- 5792 Obsidian Ave
- 5780 Cinder St
- 5791 Peridot Way
- 5760 Obsidian Ave
- 5772 Cinder St