Estimated Value: $221,229
--
Bed
--
Bath
3,662
Sq Ft
$60/Sq Ft
Est. Value
About This Home
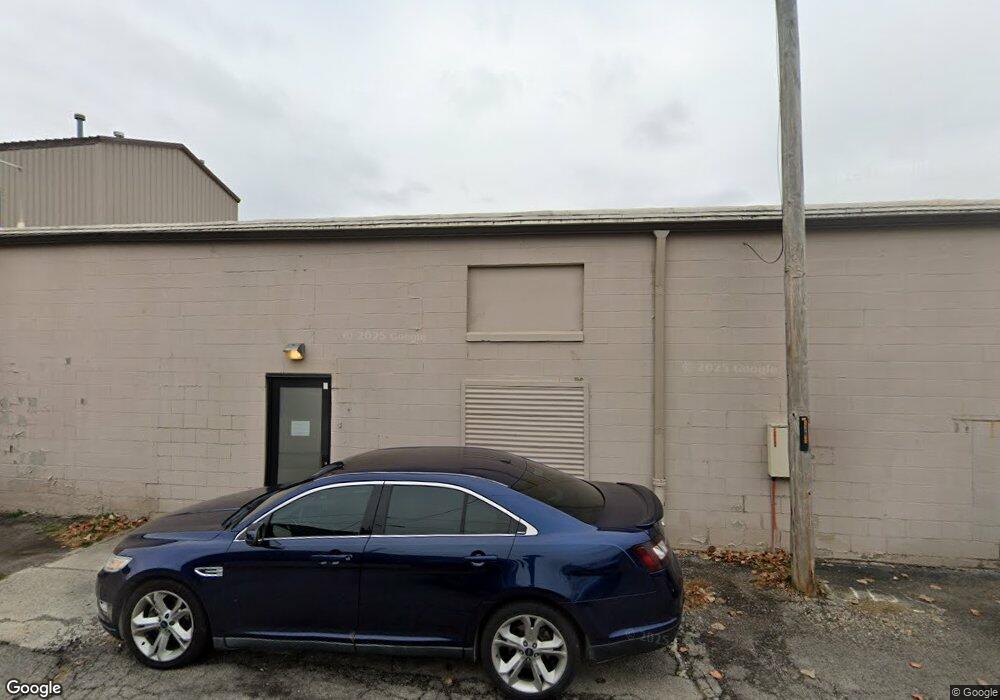
This home is located at 1601 S Dixie Hwy, Lima, OH 45804 and is currently estimated at $221,229, approximately $60 per square foot. 1601 S Dixie Hwy is a home located in Allen County with nearby schools including Elmwood Elementary School, Maplewood Elementary School, and Shawnee Middle School.
Ownership History
Date
Name
Owned For
Owner Type
Purchase Details
Closed on
Apr 3, 2015
Sold by
Kohlrieser Dale N and Kollrieser Nancy D
Bought by
Kifaru Capital Partners Llc
Current Estimated Value
Purchase Details
Closed on
Mar 30, 2015
Sold by
Kifaru Capital Partners Llc
Bought by
Agcon Properties Llc
Purchase Details
Closed on
Jul 9, 2012
Sold by
Kohlrieser Dale N and Kohlrieser Nancy D
Bought by
Kifaru Capital Partners Llc
Home Financials for this Owner
Home Financials are based on the most recent Mortgage that was taken out on this home.
Original Mortgage
$105,000
Interest Rate
3.77%
Mortgage Type
Seller Take Back
Purchase Details
Closed on
Apr 23, 2012
Sold by
Lyons Sean P and Lyons Suzanne M
Bought by
Sean Lyons Llc
Purchase Details
Closed on
May 19, 2008
Sold by
Kohlrieser Dale N and Kohlrieser Nancy D
Bought by
Lyons Sean P and Lyons Suzanne M
Create a Home Valuation Report for This Property
The Home Valuation Report is an in-depth analysis detailing your home's value as well as a comparison with similar homes in the area
Home Values in the Area
Average Home Value in this Area
Purchase History
| Date | Buyer | Sale Price | Title Company |
|---|---|---|---|
| Kifaru Capital Partners Llc | $130,000 | None Available | |
| Agcon Properties Llc | $120,000 | None Available | |
| Kifaru Capital Partners Llc | $130,000 | Attorney | |
| Sean Lyons Llc | -- | Attorney | |
| Lyons Sean P | $8,100 | None Available |
Source: Public Records
Mortgage History
| Date | Status | Borrower | Loan Amount |
|---|---|---|---|
| Previous Owner | Kifaru Capital Partners Llc | $105,000 |
Source: Public Records
Tax History Compared to Growth
Tax History
| Year | Tax Paid | Tax Assessment Tax Assessment Total Assessment is a certain percentage of the fair market value that is determined by local assessors to be the total taxable value of land and additions on the property. | Land | Improvement |
|---|---|---|---|---|
| 2024 | $3,246 | $27,940 | $6,690 | $21,250 |
| 2023 | $3,210 | $25,410 | $6,090 | $19,320 |
| 2022 | $3,172 | $25,410 | $6,090 | $19,320 |
| 2021 | $3,175 | $25,410 | $6,090 | $19,320 |
| 2020 | $3,636 | $39,060 | $6,090 | $32,970 |
| 2019 | $3,636 | $39,060 | $6,090 | $32,970 |
| 2018 | $3,832 | $39,060 | $6,090 | $32,970 |
| 2017 | $3,826 | $39,060 | $6,090 | $32,970 |
| 2016 | $3,817 | $39,060 | $6,090 | $32,970 |
| 2015 | $3,383 | $39,030 | $6,060 | $32,970 |
| 2014 | $3,383 | $34,410 | $6,060 | $28,350 |
| 2013 | $3,281 | $34,410 | $6,060 | $28,350 |
Source: Public Records
Map
Nearby Homes
- 1189 S Main St
- 1147 S Union St
- 516 Catalpa Ave
- 640 E 4th St
- 639 E 4th St
- 785 Holly St
- 839 Saint Johns Ave
- 720 S Metcalf St
- 711 W Kibby St
- 865 E 4th St
- 861 E 4th St
- 600 Dingledine Ave
- 1008 Fairview Ave
- 0 E Hanthorn Rd
- 1900 Garland Ave
- 1093 S Sugar St
- 706 E Kibby St
- 426 S Baxter St
- 380 S Pine St
- 419 S Collett St
- 1501 S Dixie Hwy
- 000 Dixie Hwy S
- 0 S Dixie Highway Rear
- 500 W 4th St
- 750 Buckeye Rd Unit B1
- 750 Buckeye Rd Unit A1
- 750 Buckeye Rd
- 1527 Mcclain Rd
- 1501 Mcclain Rd
- 1800 S Dixie Hwy
- 810 W 9th St
- 1867 S Dixie Hwy
- 1431 Mcclain Rd
- 1427 Mcclain Rd
- 216 W 6th St
- 1609 Mcclain Rd
- XXXX Mcclain Rd
- 1401 Mcclain Rd
- 1403 Mcclain Rd
- 203 W 8th St