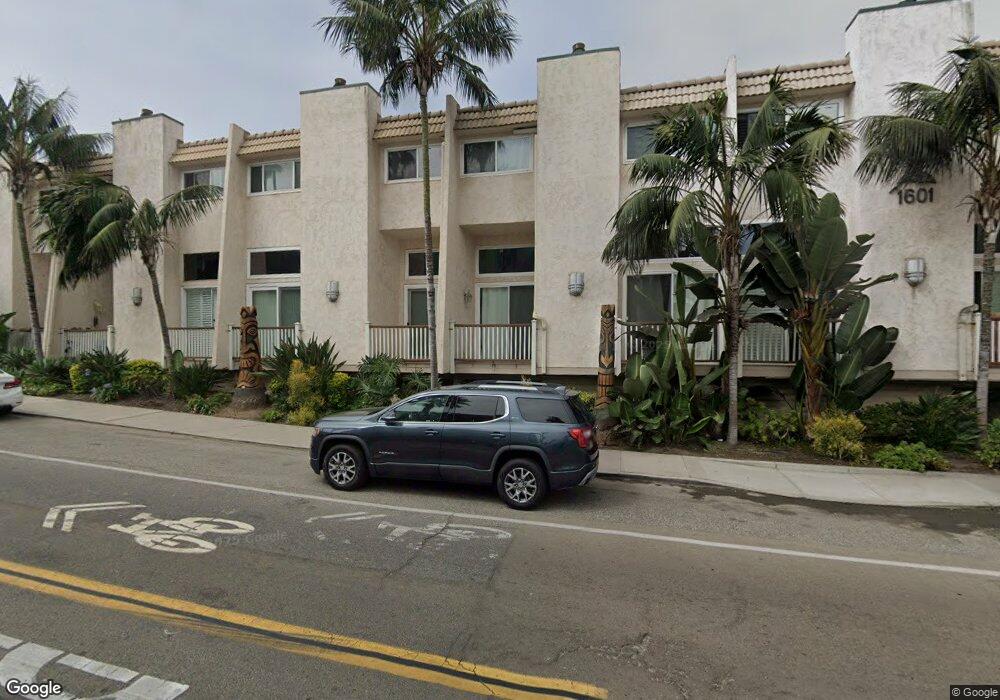
1601 S Pacific St Unit B5 Oceanside, CA 92054
South Oceanside NeighborhoodEstimated Value: $1,286,000 - $2,035,000
3
Beds
3
Baths
1,860
Sq Ft
$903/Sq Ft
Est. Value
About This Home
This home is located at 1601 S Pacific St Unit B5, Oceanside, CA 92054 and is currently estimated at $1,680,040, approximately $903 per square foot. 1601 S Pacific St Unit B5 is a home located in San Diego County with nearby schools including South Oceanside Elementary School, Lincoln Middle School, and Oceanside High School.
Ownership History
Date
Name
Owned For
Owner Type
Purchase Details
Closed on
Feb 25, 2004
Sold by
Press S James S and Press Grace
Bought by
Press Julie Ellen and Press Jamie Lee
Current Estimated Value
Purchase Details
Closed on
Jan 10, 2003
Sold by
Press S James S and Press Grace
Bought by
Press S James S and Press Grace
Purchase Details
Closed on
Jan 19, 2001
Sold by
Press S James S and Press Grace
Bought by
Press S James S and Press Grace
Purchase Details
Closed on
Jan 10, 2000
Sold by
Press S James S and Press Grace
Bought by
Press S James S and Press Grace
Purchase Details
Closed on
Aug 27, 1999
Sold by
Press S James S and Press Grace
Bought by
Press S James S and Press Grace
Purchase Details
Closed on
Oct 15, 1998
Sold by
Press S James S and Press Grace
Bought by
Press S James S and Press Grace
Purchase Details
Closed on
Mar 10, 1986
Create a Home Valuation Report for This Property
The Home Valuation Report is an in-depth analysis detailing your home's value as well as a comparison with similar homes in the area
Home Values in the Area
Average Home Value in this Area
Purchase History
| Date | Buyer | Sale Price | Title Company |
|---|---|---|---|
| Press Julie Ellen | -- | -- | |
| Press S James S | -- | -- | |
| Press S James S | -- | -- | |
| Press S James S | -- | -- | |
| Press S James S | -- | -- | |
| Press Pres S | -- | -- | |
| Press S James S | -- | -- | |
| -- | $295,000 | -- |
Source: Public Records
Tax History Compared to Growth
Tax History
| Year | Tax Paid | Tax Assessment Tax Assessment Total Assessment is a certain percentage of the fair market value that is determined by local assessors to be the total taxable value of land and additions on the property. | Land | Improvement |
|---|---|---|---|---|
| 2025 | $6,484 | $587,445 | $298,704 | $288,741 |
| 2024 | $6,484 | $575,928 | $292,848 | $283,080 |
| 2023 | $6,285 | $564,636 | $287,106 | $277,530 |
| 2022 | $6,190 | $553,566 | $281,477 | $272,089 |
| 2021 | $6,215 | $542,712 | $275,958 | $266,754 |
| 2020 | $6,023 | $537,148 | $273,129 | $264,019 |
| 2019 | $5,848 | $526,617 | $267,774 | $258,843 |
| 2018 | $5,786 | $516,292 | $262,524 | $253,768 |
| 2017 | $5,680 | $506,170 | $257,377 | $248,793 |
| 2016 | $5,497 | $496,246 | $252,331 | $243,915 |
| 2015 | $5,337 | $488,793 | $248,541 | $240,252 |
| 2014 | $5,130 | $479,219 | $243,673 | $235,546 |
Source: Public Records
Map
Nearby Homes
- 1601 S Pacific St Unit 1B
- 1445 S Pacific St
- 1445 S Pacific St Unit I
- 1727 S Pacific St
- 1409 S Pacific St
- 1401 S Pacific St Unit 205
- Plan 6 at Tower 1888
- Plan 5 at Tower 1888
- Plan 4 at Tower 1888
- Plan 3 at Tower 1888
- Plan 2 at Tower 1888
- Plan 1 at Tower 1888
- 1743 S Tremont St
- 1573 Vista Del Mar Way
- 1570 Vista Del Mar Way Unit 4
- 1506 Alvarado St
- 1834-36 S Pacific St
- 153 Sherri Ln
- 111 Sherri Ln
- 167 Sherri Ln
- 1601 S Pacific St Unit A4
- 1601 S Pacific St
- 1601 S Pacific St Unit A6
- 1601 S Pacific St Unit B6
- 1601 S Pacific St Unit B4
- 1601 S Pacific St Unit B3
- 1601 S Pacific St Unit B2
- 1601 S Pacific St Unit B1
- 1601 S Pacific St Unit A5
- 1601 S Pacific St Unit A4
- 1601 S Pacific St Unit A3
- 1601 S Pacific St Unit A2
- 1601 S Pacific St Unit A1
- 1601 S Pacific St Unit B7
- 1609 S Pacific St
- 1601 S Pacific Street #A 2
- 1513 S Pacific St
- 1611 S Pacific St
- 1511 S Pacific St
- 1509 S Pacific St