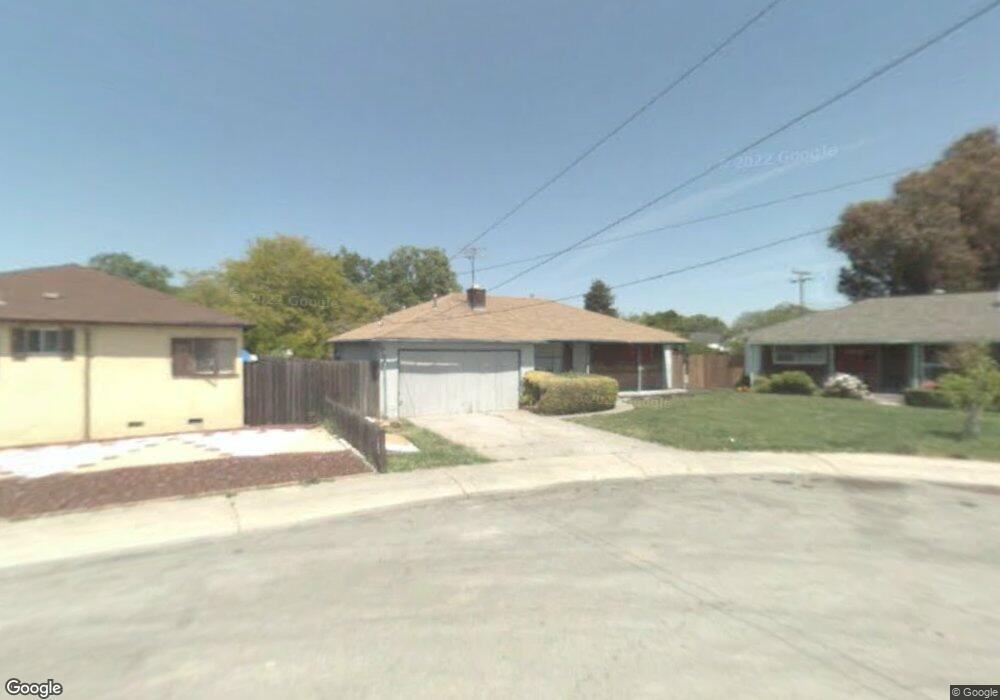
1601 Via Helena San Lorenzo, CA 94580
Estimated Value: $725,000 - $841,879
3
Beds
1
Bath
1,031
Sq Ft
$759/Sq Ft
Est. Value
About This Home
This home is located at 1601 Via Helena, San Lorenzo, CA 94580 and is currently estimated at $782,970, approximately $759 per square foot. 1601 Via Helena is a home located in Alameda County with nearby schools including Del Rey Elementary School, Bohannon Middle School, and Arroyo High School.
Ownership History
Date
Name
Owned For
Owner Type
Purchase Details
Closed on
Jan 7, 2013
Sold by
Lumley Kerry R
Bought by
Lumley Kerry R and Lumley Elizabeth
Current Estimated Value
Home Financials for this Owner
Home Financials are based on the most recent Mortgage that was taken out on this home.
Original Mortgage
$227,800
Outstanding Balance
$157,647
Interest Rate
3.27%
Mortgage Type
New Conventional
Estimated Equity
$625,323
Purchase Details
Closed on
Feb 14, 2008
Sold by
Altieri Michael and Altieri Gregory
Bought by
Lumley Kerry R and Lumley Kerry
Home Financials for this Owner
Home Financials are based on the most recent Mortgage that was taken out on this home.
Original Mortgage
$236,000
Interest Rate
5.85%
Mortgage Type
Purchase Money Mortgage
Purchase Details
Closed on
Nov 2, 1999
Sold by
Altieri Dorthy C and The Altieri Family Living Trus
Bought by
Altieri Dorothy C and The Altieri Family Living Trus
Purchase Details
Closed on
Nov 23, 1993
Sold by
Altieri Lawrence and Altieri Dorothy C
Bought by
Altieri Lawrence and Altieri Dorothy C
Create a Home Valuation Report for This Property
The Home Valuation Report is an in-depth analysis detailing your home's value as well as a comparison with similar homes in the area
Home Values in the Area
Average Home Value in this Area
Purchase History
| Date | Buyer | Sale Price | Title Company |
|---|---|---|---|
| Lumley Kerry R | -- | Chicago Title Company | |
| Lumley Kerry R | $295,000 | Fidelity National Title Co | |
| Altieri Dorothy C | -- | -- | |
| Altieri Lawrence | -- | -- |
Source: Public Records
Mortgage History
| Date | Status | Borrower | Loan Amount |
|---|---|---|---|
| Open | Lumley Kerry R | $227,800 | |
| Closed | Lumley Kerry R | $236,000 |
Source: Public Records
Tax History Compared to Growth
Tax History
| Year | Tax Paid | Tax Assessment Tax Assessment Total Assessment is a certain percentage of the fair market value that is determined by local assessors to be the total taxable value of land and additions on the property. | Land | Improvement |
|---|---|---|---|---|
| 2025 | $5,381 | $394,022 | $176,309 | $224,713 |
| 2024 | $5,381 | $386,160 | $172,852 | $220,308 |
| 2023 | $5,360 | $385,453 | $169,464 | $215,989 |
| 2022 | $5,274 | $370,897 | $166,142 | $211,755 |
| 2021 | $5,126 | $363,489 | $162,885 | $207,604 |
| 2020 | $5,010 | $366,691 | $161,215 | $205,476 |
| 2019 | $5,010 | $359,503 | $158,055 | $201,448 |
| 2018 | $4,713 | $352,456 | $154,957 | $197,499 |
| 2017 | $4,499 | $345,546 | $151,919 | $193,627 |
| 2016 | $4,290 | $338,772 | $148,941 | $189,831 |
| 2015 | $4,195 | $333,684 | $146,704 | $186,980 |
| 2014 | $4,132 | $327,149 | $143,831 | $183,318 |
Source: Public Records
Map
Nearby Homes
- 17354 Via el Cerrito
- 1867 Via Buena Vista
- 1608 Keller Ave
- 18005 Sunol Rd
- 1575 Via Lucas
- 18003 Incline Place
- 1311 Via Manzanas
- 1766 Via Redondo
- 18018 Sahara Rd
- 819 Bockman Rd
- 18251 Via Jose
- 17316 Via Flores
- 17347 Via Encinas
- 1631 Via Ventana
- 16050 Via Olinda
- 17761 Via Arriba
- 1655 Via Escondido
- 19150 Hesperian Blvd Unit 19
- 16011 Via Conejo
- 769 Bartlett Ave
- 17412 Via la Jolla
- 17406 Via la Jolla
- 1586 Via Buena Vista
- 1556 Via Buena Vista
- 17400 Via la Jolla
- 1526 Via Buena Vista
- 17420 Via la Jolla
- 1496 Via Buena Vista
- 1612 Via Helena
- 17407 Via la Jolla
- 17428 Via la Jolla
- 17401 Via la Jolla
- 1486 Via Buena Vista
- 1561 Via Buena Vista
- 1622 Via Helena
- 17429 Via la Jolla
- 1531 Via Buena Vista
- 1591 Via Buena Vista
- 1639 Via Helena
- 17436 Via la Jolla