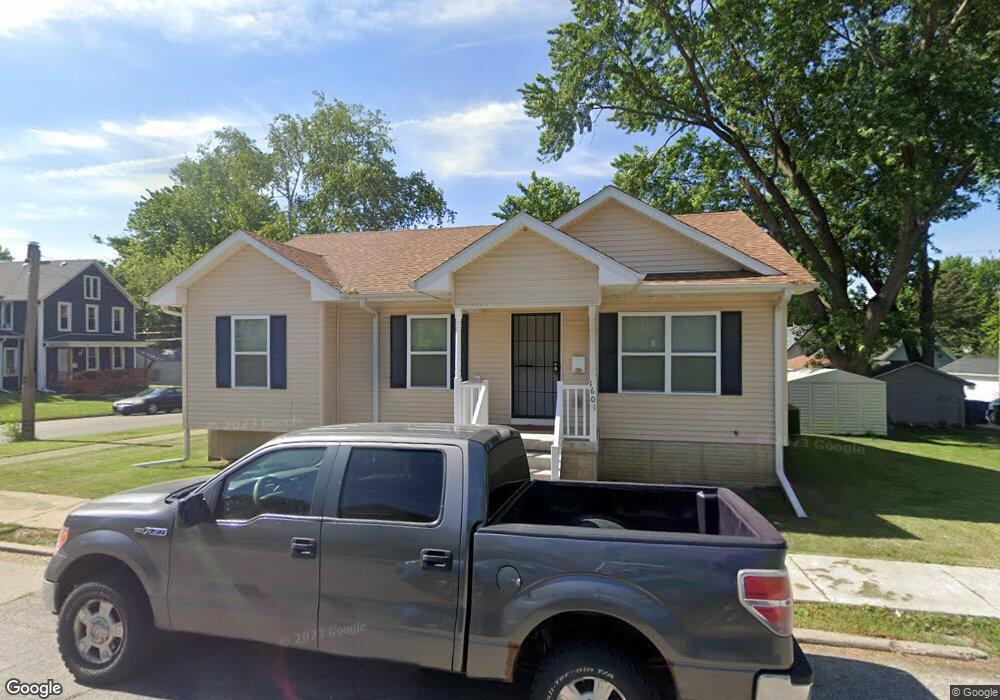
1601 W 9th St Davenport, IA 52804
Riverview Terrace NeighborhoodEstimated Value: $97,000 - $135,113
3
Beds
1
Bath
1,142
Sq Ft
$104/Sq Ft
Est. Value
About This Home
This home is located at 1601 W 9th St, Davenport, IA 52804 and is currently estimated at $118,528, approximately $103 per square foot. 1601 W 9th St is a home with nearby schools including Walnut Hill Elementary School, South Christian Elementary School, and Christian County Middle School.
Ownership History
Date
Name
Owned For
Owner Type
Purchase Details
Closed on
Dec 8, 2011
Sold by
Scott County Iowa
Bought by
Habitat For Humanity
Current Estimated Value
Purchase Details
Closed on
Aug 30, 2011
Sold by
County Of Scott
Bought by
County Of Scott
Purchase Details
Closed on
Aug 1, 2007
Sold by
Weber Delman
Bought by
Toolate Ailema
Purchase Details
Closed on
May 19, 2006
Sold by
Scott County
Bought by
Weber Delman
Purchase Details
Closed on
Nov 8, 2005
Sold by
Smith Brandon L
Bought by
Scott County
Create a Home Valuation Report for This Property
The Home Valuation Report is an in-depth analysis detailing your home's value as well as a comparison with similar homes in the area
Home Values in the Area
Average Home Value in this Area
Purchase History
| Date | Buyer | Sale Price | Title Company |
|---|---|---|---|
| Habitat For Humanity | -- | None Available | |
| County Of Scott | -- | None Available | |
| Toolate Ailema | $2,500 | None Available | |
| Weber Delman | -- | None Available | |
| Scott County | $132 | None Available |
Source: Public Records
Tax History Compared to Growth
Tax History
| Year | Tax Paid | Tax Assessment Tax Assessment Total Assessment is a certain percentage of the fair market value that is determined by local assessors to be the total taxable value of land and additions on the property. | Land | Improvement |
|---|---|---|---|---|
| 2025 | $1,166 | $126,190 | $17,120 | $109,070 |
| 2024 | $1,883 | $75,500 | $17,120 | $58,380 |
| 2023 | $1,761 | $75,500 | $17,120 | $58,380 |
| 2022 | $2,068 | $74,580 | $17,120 | $57,460 |
| 2021 | $1,408 | $74,580 | $17,120 | $57,460 |
| 2020 | $1,656 | $63,450 | $17,120 | $46,330 |
| 2019 | $745 | $39,020 | $17,120 | $21,900 |
| 2018 | $532 | $39,020 | $17,120 | $21,900 |
| 2017 | $136 | $32,940 | $17,120 | $15,820 |
| 2016 | $132 | $5,990 | $0 | $0 |
| 2015 | $132 | $5,990 | $0 | $0 |
| 2014 | $134 | $5,990 | $0 | $0 |
| 2013 | $130 | $0 | $0 | $0 |
| 2012 | -- | $4,280 | $4,280 | $0 |
Source: Public Records
Map
Nearby Homes