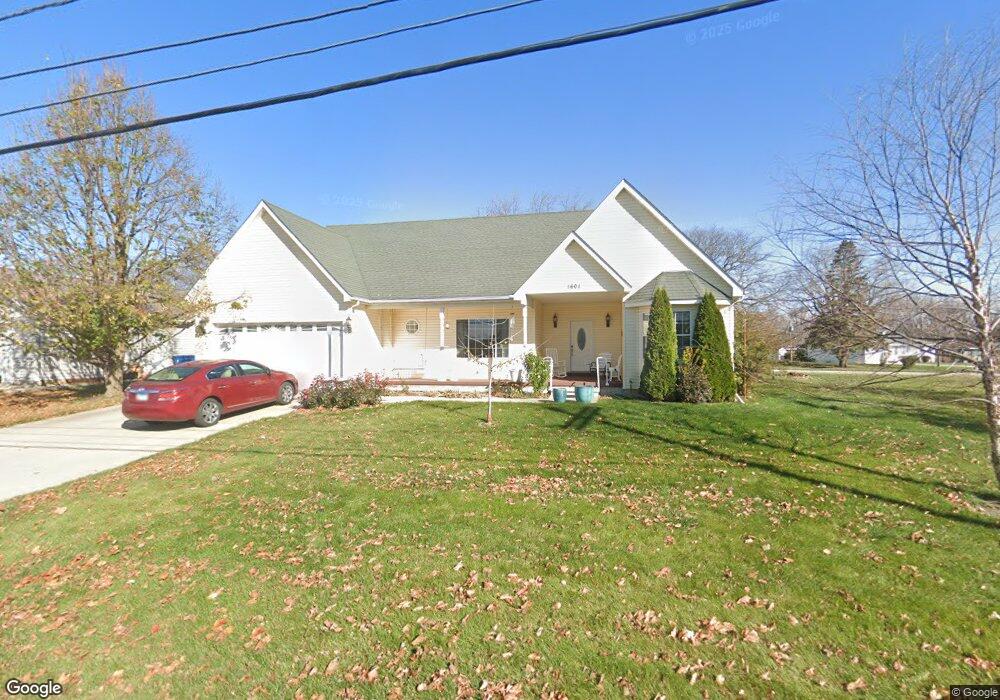
1601 W Main St Mendota, IL 61342
Estimated Value: $188,000 - $220,000
3
Beds
3
Baths
1,600
Sq Ft
$131/Sq Ft
Est. Value
About This Home
This home is located at 1601 W Main St, Mendota, IL 61342 and is currently estimated at $209,357, approximately $130 per square foot. 1601 W Main St is a home located in LaSalle County with nearby schools including Northbrook School, Lincoln Elementary School, and Blackstone Elementary School.
Ownership History
Date
Name
Owned For
Owner Type
Purchase Details
Closed on
Aug 9, 2007
Sold by
Mendota Property Corp
Bought by
Brown Eric L
Current Estimated Value
Home Financials for this Owner
Home Financials are based on the most recent Mortgage that was taken out on this home.
Original Mortgage
$79,500
Outstanding Balance
$49,948
Interest Rate
6.69%
Mortgage Type
New Conventional
Estimated Equity
$159,409
Purchase Details
Closed on
Jun 5, 2007
Sold by
Dulce Construstion Ltd
Bought by
Funk R Brian and Funk Miriam M
Purchase Details
Closed on
May 23, 2006
Sold by
Abens James R and Michelsen David E
Bought by
Dulce Construction Ltd
Create a Home Valuation Report for This Property
The Home Valuation Report is an in-depth analysis detailing your home's value as well as a comparison with similar homes in the area
Home Values in the Area
Average Home Value in this Area
Purchase History
| Date | Buyer | Sale Price | Title Company |
|---|---|---|---|
| Brown Eric L | $79,500 | First American Title | |
| Funk R Brian | -- | First American Title | |
| Dulce Construction Ltd | $42,500 | None Available |
Source: Public Records
Mortgage History
| Date | Status | Borrower | Loan Amount |
|---|---|---|---|
| Open | Brown Eric L | $79,500 |
Source: Public Records
Tax History Compared to Growth
Tax History
| Year | Tax Paid | Tax Assessment Tax Assessment Total Assessment is a certain percentage of the fair market value that is determined by local assessors to be the total taxable value of land and additions on the property. | Land | Improvement |
|---|---|---|---|---|
| 2024 | $2,631 | $51,473 | $8,644 | $42,829 |
| 2023 | $2,706 | $47,935 | $8,050 | $39,885 |
| 2022 | $2,746 | $43,701 | $7,339 | $36,362 |
| 2021 | $2,888 | $41,368 | $6,947 | $34,421 |
| 2020 | $2,659 | $39,059 | $6,559 | $32,500 |
| 2019 | $2,697 | $39,059 | $6,559 | $32,500 |
| 2018 | $2,994 | $38,203 | $6,415 | $31,788 |
| 2017 | $3,026 | $37,720 | $6,334 | $31,386 |
| 2016 | $2,897 | $36,113 | $6,064 | $30,049 |
| 2015 | $2,804 | $35,017 | $5,880 | $29,137 |
| 2012 | -- | $38,173 | $6,735 | $31,438 |
Source: Public Records
Map
Nearby Homes