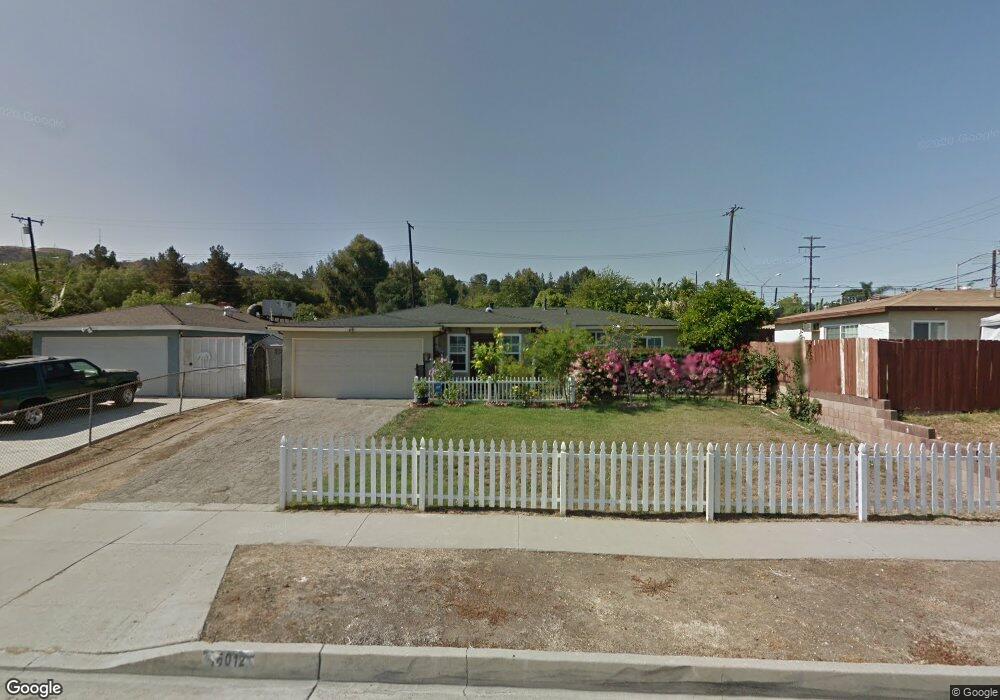
16012 Cambay St La Puente, CA 91744
Estimated Value: $774,000 - $851,000
3
Beds
2
Baths
1,516
Sq Ft
$527/Sq Ft
Est. Value
About This Home
This home is located at 16012 Cambay St, La Puente, CA 91744 and is currently estimated at $798,184, approximately $526 per square foot. 16012 Cambay St is a home located in Los Angeles County with nearby schools including Del Valle Elementary School, Sierra Vista Middle School, and William Workman High School.
Ownership History
Date
Name
Owned For
Owner Type
Purchase Details
Closed on
Jun 11, 2010
Sold by
Asset Management California Foreclosures
Bought by
Ta Christine
Current Estimated Value
Home Financials for this Owner
Home Financials are based on the most recent Mortgage that was taken out on this home.
Original Mortgage
$228,000
Interest Rate
4.52%
Mortgage Type
New Conventional
Purchase Details
Closed on
Mar 17, 2010
Sold by
Deruyter Jacob D
Bought by
Asset Management California Foreclosures
Purchase Details
Closed on
Aug 18, 2004
Sold by
Deruyter Bert and Deruyter Jacob D
Bought by
Deruyter Jacob D
Home Financials for this Owner
Home Financials are based on the most recent Mortgage that was taken out on this home.
Original Mortgage
$208,000
Interest Rate
5.95%
Mortgage Type
New Conventional
Purchase Details
Closed on
Nov 13, 1996
Sold by
Deruyter Francine
Bought by
Deruyter Francine and Francine Deruyter Trust
Create a Home Valuation Report for This Property
The Home Valuation Report is an in-depth analysis detailing your home's value as well as a comparison with similar homes in the area
Home Values in the Area
Average Home Value in this Area
Purchase History
| Date | Buyer | Sale Price | Title Company |
|---|---|---|---|
| Ta Christine | $285,000 | Lawyers Title | |
| Asset Management California Foreclosures | $196,554 | None Available | |
| Deruyter Jacob D | -- | United Title Company-La | |
| Deruyter Bert | -- | United Title Company | |
| Deruyter Francine | -- | -- |
Source: Public Records
Mortgage History
| Date | Status | Borrower | Loan Amount |
|---|---|---|---|
| Previous Owner | Ta Christine | $228,000 | |
| Previous Owner | Deruyter Jacob D | $208,000 |
Source: Public Records
Tax History Compared to Growth
Tax History
| Year | Tax Paid | Tax Assessment Tax Assessment Total Assessment is a certain percentage of the fair market value that is determined by local assessors to be the total taxable value of land and additions on the property. | Land | Improvement |
|---|---|---|---|---|
| 2025 | $5,652 | $451,802 | $194,731 | $257,071 |
| 2024 | $5,652 | $442,944 | $190,913 | $252,031 |
| 2023 | $5,509 | $434,260 | $187,170 | $247,090 |
| 2022 | $5,349 | $425,746 | $183,500 | $242,246 |
| 2021 | $5,252 | $417,399 | $179,902 | $237,497 |
| 2019 | $5,101 | $405,020 | $174,567 | $230,453 |
| 2018 | $4,937 | $397,080 | $171,145 | $225,935 |
| 2016 | $4,575 | $381,662 | $164,500 | $217,162 |
| 2015 | $4,490 | $375,931 | $162,030 | $213,901 |
| 2014 | $4,418 | $368,568 | $158,857 | $209,711 |
Source: Public Records
Map
Nearby Homes
- 665 Larimore Ave
- 15879 Hill St
- 545 N 5th St
- 15732 Victoria Ave
- 826 Del Valle Ave
- 15900 Rowland St
- 15625 Loukelton St
- 138 Banbridge Ave
- 11 Alley Way
- 15416 Giordano St
- 16322 Main St
- 16115 Central Ave
- 15925 Amar Rd
- 665 Lidford Ave
- 15937 Amar Rd
- 15943 Amar Rd
- 15947 Amar Rd
- 1084 Del Valle Ave
- 16149 Abbey St
- 16142 Abbey St
- 16018 Cambay St
- 612 Del Valle Ave
- 604 Del Valle Ave
- 16024 Cambay St
- 623 Larimore Ave
- 16030 Cambay St
- 624 Del Valle Ave
- 540 Del Valle Ave
- 629 Larimore Ave
- 15956 Cambay St
- 16036 Cambay St
- 632 Del Valle Ave
- 622 Larimore Ave
- 534 Del Valle Ave
- 15959 Cambay St
- 637 Larimore Ave
- 630 Larimore Ave
- 15953 Cambay St
- 16042 Cambay St
- 638 Del Valle Ave