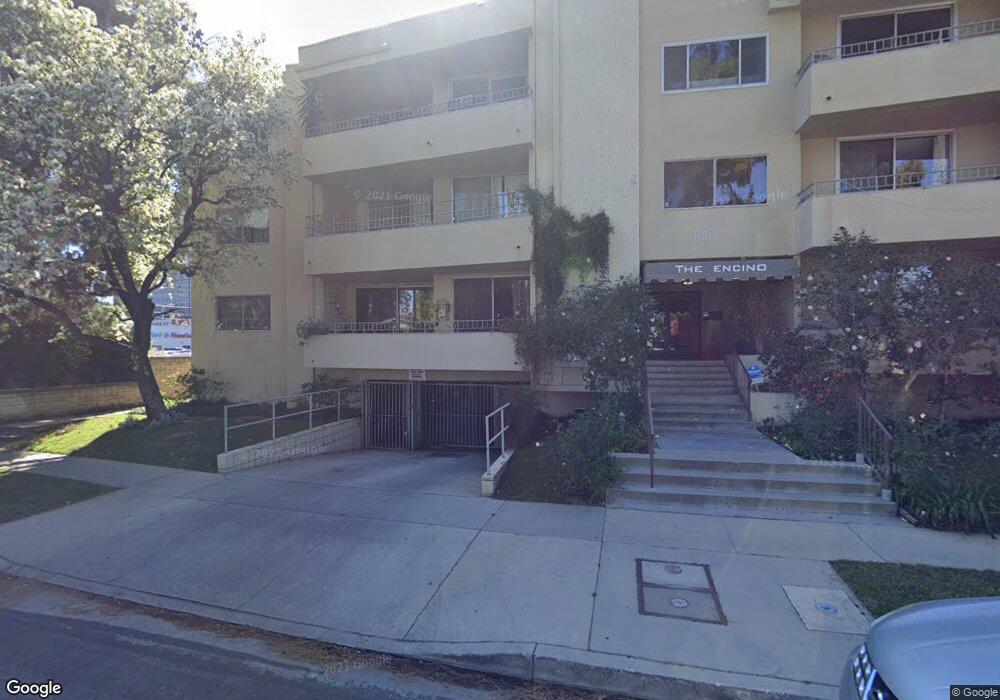
16012 Moorpark St Unit 201A Encino, CA 91436
Estimated Value: $706,158 - $784,000
2
Beds
2
Baths
1,410
Sq Ft
$533/Sq Ft
Est. Value
About This Home
This home is located at 16012 Moorpark St Unit 201A, Encino, CA 91436 and is currently estimated at $752,040, approximately $533 per square foot. 16012 Moorpark St Unit 201A is a home located in Los Angeles County with nearby schools including William Mulholland Middle, Hesby Oaks Elementary School, and Encino Charter Elementary.
Ownership History
Date
Name
Owned For
Owner Type
Purchase Details
Closed on
Jan 22, 2016
Sold by
Badymoghaddam Yaghoub and Badymoghaddam Haydeh
Bought by
Yaghoub Badymoghaddam and Yaghoub Haydeh Badymogha
Current Estimated Value
Purchase Details
Closed on
Apr 8, 2015
Sold by
Liu Jonathan Hsu and Shih Angela Hung Ying
Bought by
Badymoghaddam Yaghoub and Badymoghaddam Haydeh
Home Financials for this Owner
Home Financials are based on the most recent Mortgage that was taken out on this home.
Original Mortgage
$280,000
Interest Rate
3.64%
Mortgage Type
New Conventional
Purchase Details
Closed on
Oct 3, 2005
Sold by
16012 Moorpark St Llc
Bought by
Liu Jonathan Hsu and Shih Angela Hung Ying
Home Financials for this Owner
Home Financials are based on the most recent Mortgage that was taken out on this home.
Original Mortgage
$408,000
Interest Rate
5.7%
Mortgage Type
Fannie Mae Freddie Mac
Create a Home Valuation Report for This Property
The Home Valuation Report is an in-depth analysis detailing your home's value as well as a comparison with similar homes in the area
Home Values in the Area
Average Home Value in this Area
Purchase History
| Date | Buyer | Sale Price | Title Company |
|---|---|---|---|
| Yaghoub Badymoghaddam | -- | Accommodation | |
| Badymoghaddam Yaghoub | $400,000 | Progressive Title Company | |
| Liu Jonathan Hsu | $510,000 | Chicago Title |
Source: Public Records
Mortgage History
| Date | Status | Borrower | Loan Amount |
|---|---|---|---|
| Previous Owner | Badymoghaddam Yaghoub | $280,000 | |
| Previous Owner | Liu Jonathan Hsu | $408,000 |
Source: Public Records
Tax History Compared to Growth
Tax History
| Year | Tax Paid | Tax Assessment Tax Assessment Total Assessment is a certain percentage of the fair market value that is determined by local assessors to be the total taxable value of land and additions on the property. | Land | Improvement |
|---|---|---|---|---|
| 2025 | $5,830 | $480,731 | $192,291 | $288,440 |
| 2024 | $5,830 | $471,306 | $188,521 | $282,785 |
| 2023 | $5,718 | $462,066 | $184,825 | $277,241 |
| 2022 | $5,450 | $453,006 | $181,201 | $271,805 |
| 2021 | $5,379 | $444,125 | $177,649 | $266,476 |
| 2020 | $5,432 | $439,572 | $175,828 | $263,744 |
| 2019 | $5,217 | $430,954 | $172,381 | $258,573 |
| 2018 | $5,191 | $422,504 | $169,001 | $253,503 |
| 2016 | $4,953 | $406,100 | $162,440 | $243,660 |
| 2015 | $4,942 | $412,100 | $162,000 | $250,100 |
| 2014 | $4,595 | $374,000 | $147,000 | $227,000 |
Source: Public Records
Map
Nearby Homes
- 4831 Collett Ave
- 4846 Gaviota Ave
- 4630 Woodley Ave Unit 205
- 4544 Woodley Ave
- 4950 Woodley Ave
- 4830 Valjean Ave
- 5019 Gaviota Ave
- 15916 Daniel Ln
- 4602 Hurford Terrace
- 16206 Morrison St
- 5062 Woodley Ave
- 16032 Valley Vista Blvd
- 16216 Bertella Dr
- 4610 Densmore Ave Unit 105
- 4610 Densmore Ave Unit 10
- 4960 Densmore Ave
- 15709 Milbank St
- 4418 Woodley Ave
- 4440 Bergamo Dr
- 4632 Libbit Ave
- 16012 Moorpark St Unit 103
- 16012 Moorpark St
- 16012 Moorpark St Unit 103A
- 16012 Moorpark St Unit 204A
- 16012 Moorpark St Unit 104A
- 16012 Moorpark St Unit 305A
- 16012 Moorpark St Unit 205A
- 16012 Moorpark St Unit 202A
- 16012 Moorpark St Unit 103A
- 16012 Moorpark St Unit 101A
- 16012 Moorpark St Unit 304A
- 16012 Moorpark St Unit 102
- 16012 Moorpark St Unit 303A
- 16012 Moorpark St Unit 302A
- 16012 Moorpark St Unit 203A
- 16012 Moorpark St Unit 105A
- 16022 Moorpark St Unit 305
- 16022 Moorpark St Unit 304
- 16022 Moorpark St Unit 303
- 16022 Moorpark St Unit 302