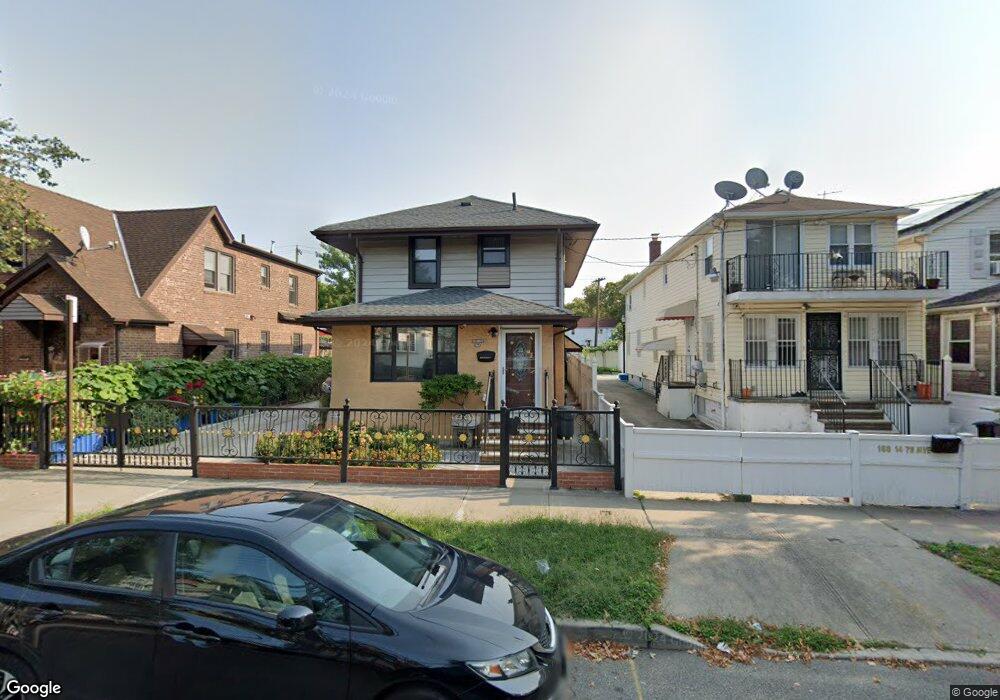
16016 79th Ave Fresh Meadows, NY 11366
Kew Gardens Hills NeighborhoodEstimated Value: $1,045,253 - $1,262,000
2
Beds
2
Baths
1,560
Sq Ft
$725/Sq Ft
Est. Value
About This Home
This home is located at 16016 79th Ave, Fresh Meadows, NY 11366 and is currently estimated at $1,131,063, approximately $725 per square foot. 16016 79th Ave is a home located in Queens County with nearby schools including P.S. 154, I.S. 250 - The Robert F. Kennedy Community Middle School, and Al-Mamoor School.
Ownership History
Date
Name
Owned For
Owner Type
Purchase Details
Closed on
Nov 27, 2023
Sold by
Li Wei and Zhong Hui Min
Bought by
Li Wei
Current Estimated Value
Purchase Details
Closed on
Oct 31, 2018
Sold by
Zhong Hui Min
Bought by
Li Wei and Zhong Hui Min
Purchase Details
Closed on
Mar 29, 2017
Sold by
Crisostomo Christopher C and Crisostomo Patricia M
Bought by
Zhong Hui Min
Home Financials for this Owner
Home Financials are based on the most recent Mortgage that was taken out on this home.
Original Mortgage
$400,000
Interest Rate
4.16%
Mortgage Type
New Conventional
Purchase Details
Closed on
Jul 19, 2005
Sold by
Crisostomo Eugenio and Crisostomo Maria -
Bought by
Crisostomo Christopher C and Crisostomo Patricia M
Purchase Details
Closed on
Nov 3, 1997
Sold by
Clemente Victor and Clemente Josefa
Bought by
Crisostomo Josephine Paz Clemente
Create a Home Valuation Report for This Property
The Home Valuation Report is an in-depth analysis detailing your home's value as well as a comparison with similar homes in the area
Home Values in the Area
Average Home Value in this Area
Purchase History
| Date | Buyer | Sale Price | Title Company |
|---|---|---|---|
| Li Wei | -- | -- | |
| Li Wei | -- | -- | |
| Li Wei | -- | -- | |
| Li Wei | -- | -- | |
| Zhong Hui Min | $850,000 | -- | |
| Zhong Hui Min | $850,000 | -- | |
| Crisostomo Christopher C | -- | -- | |
| Crisostomo Christopher C | -- | -- | |
| Crisostomo Josephine Paz Clemente | -- | Fidelity National Title Ins | |
| Crisostomo Josephine Paz Clemente | -- | Fidelity National Title Ins |
Source: Public Records
Mortgage History
| Date | Status | Borrower | Loan Amount |
|---|---|---|---|
| Previous Owner | Zhong Hui Min | $400,000 |
Source: Public Records
Tax History Compared to Growth
Tax History
| Year | Tax Paid | Tax Assessment Tax Assessment Total Assessment is a certain percentage of the fair market value that is determined by local assessors to be the total taxable value of land and additions on the property. | Land | Improvement |
|---|---|---|---|---|
| 2025 | $8,941 | $46,904 | $12,061 | $34,843 |
| 2024 | $8,941 | $44,516 | $10,753 | $33,763 |
| 2023 | $8,556 | $42,128 | $10,783 | $31,345 |
| 2022 | $8,333 | $56,460 | $16,740 | $39,720 |
| 2021 | $8,695 | $46,800 | $16,740 | $30,060 |
| 2020 | $8,274 | $47,340 | $16,740 | $30,600 |
| 2019 | $7,760 | $40,560 | $16,740 | $23,820 |
| 2018 | $7,157 | $35,107 | $15,709 | $19,398 |
| 2017 | $6,763 | $33,177 | $15,636 | $17,541 |
| 2016 | $6,561 | $33,177 | $15,636 | $17,541 |
| 2015 | $3,775 | $30,964 | $13,203 | $17,761 |
| 2014 | $3,775 | $29,306 | $14,991 | $14,315 |
Source: Public Records
Map
Nearby Homes
- 158-16 79th Ave Unit 411n
- 15815 Union Turnpike Unit 2B
- 158-15 Union Turnpike Unit 2A
- 158-15 Union Turnpike Unit 205N
- 158-15 Union Turnpike Unit 209N
- 158-36 77th Rd
- 8041 159th St
- 77-14 162nd St
- 15315 79th Ave
- 15307 79th Ave
- 158-18 77th Ave
- 16414 81st Ave
- 8102 164th Place
- 8108 164th Place
- 153-51 77th Rd
- 76-33 160th St
- 162-15 77th Ave
- 8012 165th St
- 153-44 77th Ave
- 15205 79th Ave
- 16016 79th Ave Unit 2nd Fl
- 16016 79th Ave Unit 1 Fl
- 16016 79th Ave
- 16016 79th Ave Unit 2FL
- 16016 79th Ave Unit 2nd Fl
- 16016 79th Ave Unit 1st Fl
- 16016 79th Ave Unit 1 Fl
- 160-16 79th Ave
- 160-16 79th Ave Unit 2FL
- 16016 79th Ave
- 16014 79th Ave
- 160-14 79th Ave
- 16020 79th Ave
- 16020 79th Ave
- 16020 79th Ave Unit 2nd FL
- 16020 79th Ave
- 16020 79th Ave
- 16010 79th Ave
- 160-20 79 Ave
- 16010 79th Ave