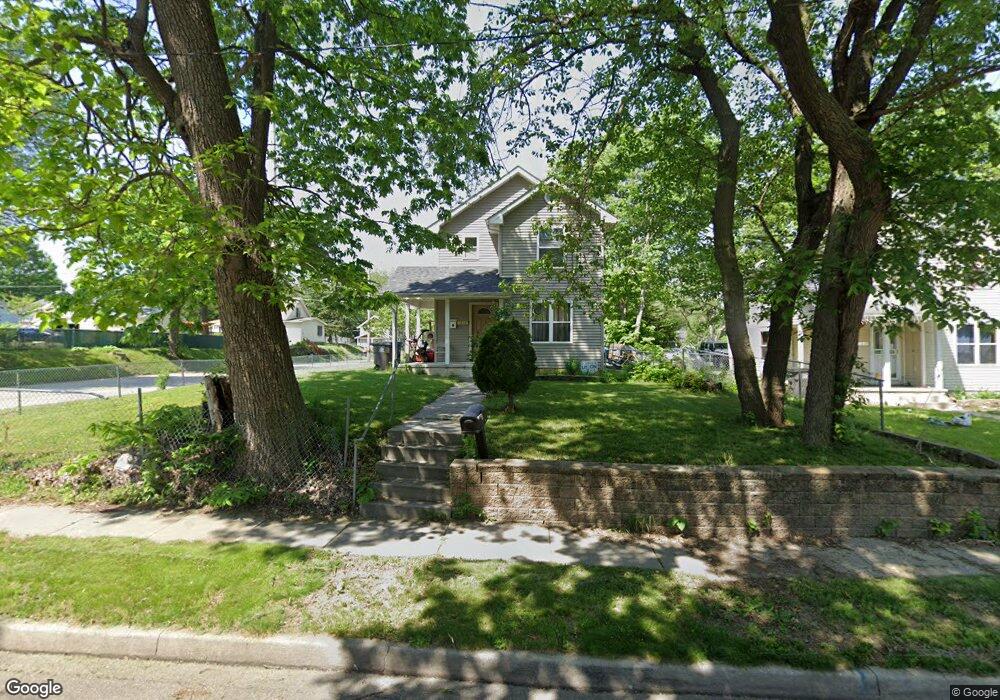
1602 12th St Des Moines, IA 50314
King Irving NeighborhoodEstimated Value: $144,000 - $212,000
3
Beds
2
Baths
1,026
Sq Ft
$170/Sq Ft
Est. Value
About This Home
This home is located at 1602 12th St, Des Moines, IA 50314 and is currently estimated at $174,542, approximately $170 per square foot. 1602 12th St is a home located in Polk County with nearby schools including Moulton Elementary School, Harding Middle School, and North High School.
Ownership History
Date
Name
Owned For
Owner Type
Purchase Details
Closed on
Sep 23, 1999
Sold by
Ben Keystone Construction Lc
Bought by
Torres Elsy E
Current Estimated Value
Home Financials for this Owner
Home Financials are based on the most recent Mortgage that was taken out on this home.
Original Mortgage
$61,600
Outstanding Balance
$18,276
Interest Rate
7.83%
Estimated Equity
$156,266
Purchase Details
Closed on
Apr 30, 1998
Sold by
Smith Cornell R and Harris Connie Faye
Bought by
Ben Keystone Construction L C
Create a Home Valuation Report for This Property
The Home Valuation Report is an in-depth analysis detailing your home's value as well as a comparison with similar homes in the area
Home Values in the Area
Average Home Value in this Area
Purchase History
| Date | Buyer | Sale Price | Title Company |
|---|---|---|---|
| Torres Elsy E | $97,500 | -- | |
| Ben Keystone Construction L C | $500 | -- |
Source: Public Records
Mortgage History
| Date | Status | Borrower | Loan Amount |
|---|---|---|---|
| Open | Torres Elsy E | $61,600 | |
| Closed | Torres Elsy E | $12,500 |
Source: Public Records
Tax History
| Year | Tax Paid | Tax Assessment Tax Assessment Total Assessment is a certain percentage of the fair market value that is determined by local assessors to be the total taxable value of land and additions on the property. | Land | Improvement |
|---|---|---|---|---|
| 2025 | $2,062 | $131,400 | $14,400 | $117,000 |
| 2024 | $2,062 | $115,300 | $12,300 | $103,000 |
| 2023 | $1,810 | $115,300 | $12,300 | $103,000 |
| 2022 | $1,794 | $85,700 | $9,400 | $76,300 |
| 2021 | $1,700 | $85,700 | $9,400 | $76,300 |
| 2020 | $1,760 | $76,700 | $8,400 | $68,300 |
| 2019 | $1,660 | $76,700 | $8,400 | $68,300 |
| 2018 | $1,638 | $70,300 | $7,400 | $62,900 |
| 2017 | $1,708 | $70,300 | $7,400 | $62,900 |
| 2016 | $1,660 | $71,700 | $7,400 | $64,300 |
| 2015 | $1,660 | $71,700 | $7,400 | $64,300 |
| 2014 | $1,522 | $66,000 | $7,500 | $58,500 |
Source: Public Records
Map
Nearby Homes
Your Personal Tour Guide
Ask me questions while you tour the home.