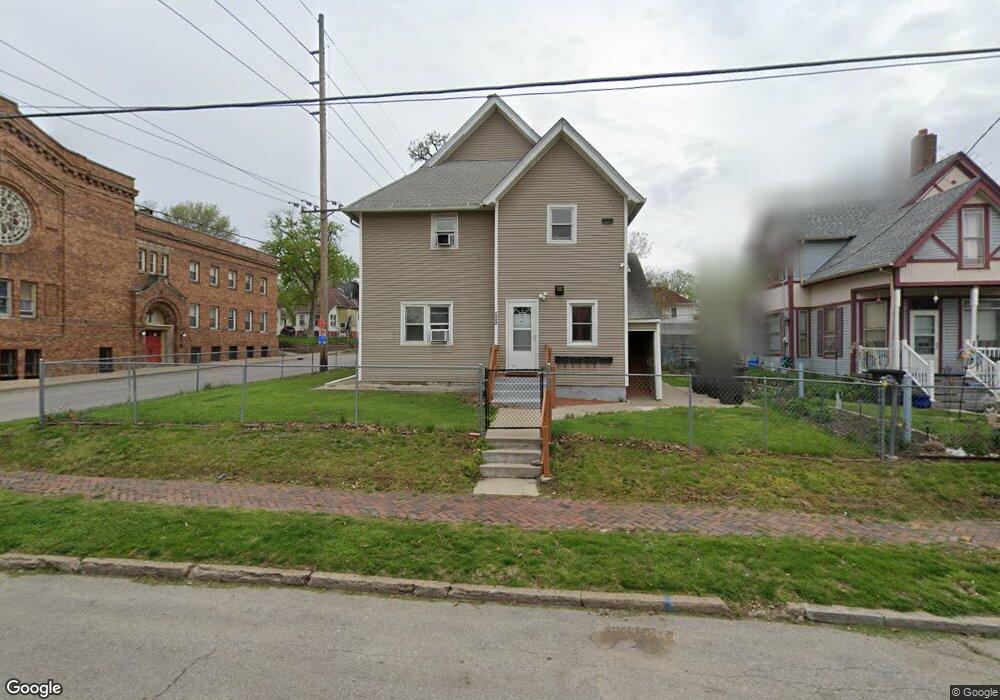
1602 8th St Des Moines, IA 50314
River Bend NeighborhoodEstimated Value: $105,000
--
Bed
4
Baths
4,672
Sq Ft
$22/Sq Ft
Est. Value
About This Home
This home is located at 1602 8th St, Des Moines, IA 50314 and is currently estimated at $105,000, approximately $22 per square foot. 1602 8th St is a home located in Polk County with nearby schools including Moulton Elementary School, Harding Middle School, and North High School.
Ownership History
Date
Name
Owned For
Owner Type
Purchase Details
Closed on
Oct 27, 2008
Sold by
Iowa State Bank
Bought by
Catalan Manuel D and Aguilar Ena
Current Estimated Value
Home Financials for this Owner
Home Financials are based on the most recent Mortgage that was taken out on this home.
Original Mortgage
$49,500
Interest Rate
5.53%
Mortgage Type
Seller Take Back
Purchase Details
Closed on
Apr 2, 2001
Sold by
Property Concept Group
Bought by
Benson Larry
Home Financials for this Owner
Home Financials are based on the most recent Mortgage that was taken out on this home.
Original Mortgage
$26,250
Interest Rate
7.05%
Mortgage Type
Commercial
Create a Home Valuation Report for This Property
The Home Valuation Report is an in-depth analysis detailing your home's value as well as a comparison with similar homes in the area
Home Values in the Area
Average Home Value in this Area
Purchase History
| Date | Buyer | Sale Price | Title Company |
|---|---|---|---|
| Catalan Manuel D | $54,500 | Itc | |
| Benson Larry | $34,500 | -- |
Source: Public Records
Mortgage History
| Date | Status | Borrower | Loan Amount |
|---|---|---|---|
| Closed | Catalan Manuel D | $49,500 | |
| Previous Owner | Benson Larry | $26,250 |
Source: Public Records
Tax History Compared to Growth
Tax History
| Year | Tax Paid | Tax Assessment Tax Assessment Total Assessment is a certain percentage of the fair market value that is determined by local assessors to be the total taxable value of land and additions on the property. | Land | Improvement |
|---|---|---|---|---|
| 2025 | $1,830 | $100,000 | $9,000 | $91,000 |
| 2024 | $1,830 | $93,000 | $7,900 | $85,100 |
| 2023 | $1,782 | $93,000 | $7,900 | $85,100 |
| 2022 | $2,082 | $75,600 | $6,600 | $69,000 |
| 2021 | $1,852 | $75,600 | $6,600 | $69,000 |
| 2020 | $2,080 | $62,000 | $6,000 | $56,000 |
| 2019 | $1,824 | $62,000 | $6,000 | $56,000 |
| 2018 | $1,940 | $51,500 | $6,000 | $45,500 |
| 2017 | $1,822 | $51,500 | $6,000 | $45,500 |
| 2016 | $1,900 | $46,500 | $5,000 | $41,500 |
| 2015 | $1,900 | $46,500 | $5,000 | $41,500 |
| 2014 | $1,856 | $41,500 | $5,000 | $36,500 |
Source: Public Records
Map
Nearby Homes