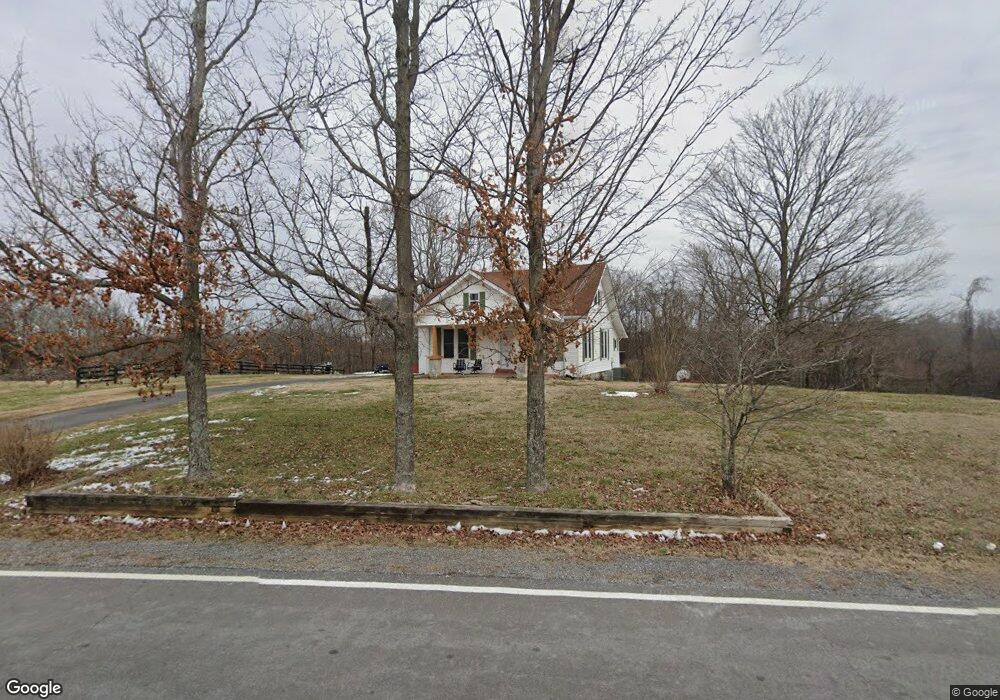
1602 Campbell Rd Goodlettsville, TN 37072
Estimated Value: $248,967 - $340,000
2
Beds
1
Bath
1,280
Sq Ft
$245/Sq Ft
Est. Value
About This Home
This home is located at 1602 Campbell Rd, Goodlettsville, TN 37072 and is currently estimated at $312,992, approximately $244 per square foot. 1602 Campbell Rd is a home located in Davidson County with nearby schools including Old Center Elementary, Goodlettsville Middle School, and Hunters Lane Comprehensive High School.
Ownership History
Date
Name
Owned For
Owner Type
Purchase Details
Closed on
Jan 26, 2024
Sold by
Moore Gary L and Moore Sally S
Bought by
Taylor James W and Taylor Melissa L
Current Estimated Value
Home Financials for this Owner
Home Financials are based on the most recent Mortgage that was taken out on this home.
Original Mortgage
$145,000
Outstanding Balance
$142,438
Interest Rate
6.61%
Mortgage Type
Seller Take Back
Estimated Equity
$170,555
Purchase Details
Closed on
Mar 12, 2001
Sold by
Freson George H
Bought by
Moore Gary L and Moore Sally S
Purchase Details
Closed on
Jan 16, 1998
Sold by
Freson George H and Moore Gary L
Bought by
Freson George H
Purchase Details
Closed on
Nov 28, 1997
Sold by
Freson George H and Moore Gary L
Bought by
Moore Gary L and Moore Sally S
Purchase Details
Closed on
Mar 26, 1997
Sold by
Fanning Leon
Bought by
Freson George H
Create a Home Valuation Report for This Property
The Home Valuation Report is an in-depth analysis detailing your home's value as well as a comparison with similar homes in the area
Home Values in the Area
Average Home Value in this Area
Purchase History
| Date | Buyer | Sale Price | Title Company |
|---|---|---|---|
| Taylor James W | $145,000 | Bell & Alexander Title | |
| Moore Gary L | -- | None Available | |
| Freson George H | -- | -- | |
| Moore Gary L | -- | -- | |
| Freson George H | $179,900 | -- |
Source: Public Records
Mortgage History
| Date | Status | Borrower | Loan Amount |
|---|---|---|---|
| Open | Taylor James W | $145,000 |
Source: Public Records
Tax History Compared to Growth
Tax History
| Year | Tax Paid | Tax Assessment Tax Assessment Total Assessment is a certain percentage of the fair market value that is determined by local assessors to be the total taxable value of land and additions on the property. | Land | Improvement |
|---|---|---|---|---|
| 2024 | $1,114 | $38,125 | $16,025 | $22,100 |
| 2023 | $1,114 | $38,125 | $16,025 | $22,100 |
| 2022 | $1,114 | $38,125 | $16,025 | $22,100 |
| 2021 | $1,126 | $38,125 | $16,025 | $22,100 |
| 2020 | $1,064 | $28,100 | $10,675 | $17,425 |
| 2019 | $774 | $28,100 | $10,675 | $17,425 |
| 2018 | $774 | $28,100 | $10,675 | $17,425 |
| 2017 | $774 | $28,100 | $10,675 | $17,425 |
| 2016 | $1,087 | $27,700 | $11,475 | $16,225 |
| 2015 | $1,087 | $27,700 | $11,475 | $16,225 |
| 2014 | $1,087 | $27,700 | $11,475 | $16,225 |
Source: Public Records
Map
Nearby Homes
- 4849 Brick Church Pike
- 4794 Brick Church Pike
- 824 Dry Creek Rd
- 1295 Campbell Rd
- 467 Dry Creek Rd
- 1598 Hunters Ln
- 2344 Misty Creek Ct
- 0 Lowes Ln
- 4290 Brick Church Pike
- 2584 Misty Creek Ct
- 2846 Misty Creek Ct
- 1765 Misty Creek Ct
- 2269 Misty Creek Ct
- 2140 Creekland View Blvd
- 0
- 5259 Brick Church Pike
- 1110 Old Dickerson Pike
- 2021 Creekland View Blvd
- The Stanford Plan at Heritage Creek
- The Heartland Plan at Heritage Creek
- 1631 Campbell Rd
- 1592 Campbell Rd
- 1620 Campbell Rd
- 1624 Campbell Rd
- 1593 Campbell Rd
- 1581 Campbell Rd
- 1634 Campbell Rd
- 1644 Campbell Rd
- 1574 Campbell Rd
- 1695 Campbell Rd
- 620 Dry Creek Rd
- 1651 Campbell Rd
- 1562 Campbell Rd
- 1556 Campbell Rd
- 1676 Campbell Rd
- 1658 Campbell Rd
- 1672 Campbell Rd
- 1550 Campbell Rd
- 1688 Campbell Rd
- 1544 Campbell Rd