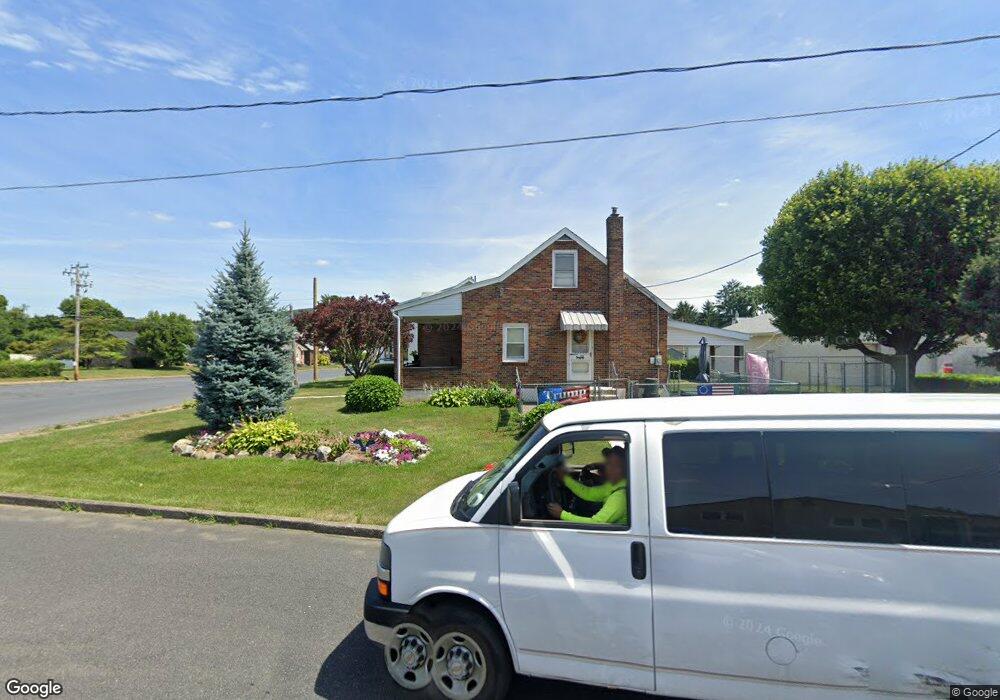
1602 Chapel Ave Unit 1608 Allentown, PA 18103
Southside NeighborhoodEstimated Value: $272,000 - $322,000
2
Beds
1
Bath
1,326
Sq Ft
$228/Sq Ft
Est. Value
About This Home
This home is located at 1602 Chapel Ave Unit 1608, Allentown, PA 18103 and is currently estimated at $301,765, approximately $227 per square foot. 1602 Chapel Ave Unit 1608 is a home located in Lehigh County with nearby schools including Castle Dale School, Roosevelt Elementary School, and South Mountain Middle School.
Ownership History
Date
Name
Owned For
Owner Type
Purchase Details
Closed on
Nov 25, 2015
Sold by
Hirzi Peggy Lee and Bissey Peggy L
Bought by
Bissey Peggy L and Bissey Daniel D
Current Estimated Value
Home Financials for this Owner
Home Financials are based on the most recent Mortgage that was taken out on this home.
Original Mortgage
$93,000
Outstanding Balance
$56,413
Interest Rate
3.83%
Mortgage Type
New Conventional
Estimated Equity
$245,352
Purchase Details
Closed on
Dec 18, 2006
Sold by
Hirzi Frank Carl and Hirzi Peggy Lee
Bought by
Hirzi Peggy Lee
Purchase Details
Closed on
Mar 25, 1993
Sold by
Hirzi Frank Carl and Williams Peggy L
Bought by
Hirzi Frank Carl and Peggy Lee
Purchase Details
Closed on
Mar 31, 1988
Sold by
Ward Michael R and Ward Gwenn
Bought by
Hirzi Frank Carl and Williams Peggy L
Purchase Details
Closed on
May 24, 1985
Bought by
Ward Michael R and Ward Gwenn
Create a Home Valuation Report for This Property
The Home Valuation Report is an in-depth analysis detailing your home's value as well as a comparison with similar homes in the area
Home Values in the Area
Average Home Value in this Area
Purchase History
| Date | Buyer | Sale Price | Title Company |
|---|---|---|---|
| Bissey Peggy L | -- | Attorney | |
| Hirzi Peggy Lee | -- | None Available | |
| Hirzi Frank Carl | -- | -- | |
| Hirzi Frank Carl | $85,000 | -- | |
| Ward Michael R | $48,000 | -- |
Source: Public Records
Mortgage History
| Date | Status | Borrower | Loan Amount |
|---|---|---|---|
| Open | Bissey Peggy L | $93,000 |
Source: Public Records
Tax History Compared to Growth
Tax History
| Year | Tax Paid | Tax Assessment Tax Assessment Total Assessment is a certain percentage of the fair market value that is determined by local assessors to be the total taxable value of land and additions on the property. | Land | Improvement |
|---|---|---|---|---|
| 2025 | $5,300 | $149,700 | $35,500 | $114,200 |
| 2024 | $5,300 | $149,700 | $35,500 | $114,200 |
| 2023 | $5,300 | $149,700 | $35,500 | $114,200 |
| 2022 | $5,129 | $149,700 | $114,200 | $35,500 |
| 2021 | $5,035 | $149,700 | $35,500 | $114,200 |
| 2020 | $4,915 | $149,700 | $35,500 | $114,200 |
| 2019 | $4,842 | $149,700 | $35,500 | $114,200 |
| 2018 | $4,459 | $149,700 | $35,500 | $114,200 |
| 2017 | $4,354 | $149,700 | $35,500 | $114,200 |
| 2016 | -- | $149,700 | $35,500 | $114,200 |
| 2015 | -- | $149,700 | $35,500 | $114,200 |
| 2014 | -- | $149,700 | $35,500 | $114,200 |
Source: Public Records
Map
Nearby Homes
- 135 W Wabash St
- 203 W Brookdale St
- 148 W Brookdale St
- 101 W Susquehanna St
- 38 E Susquehanna St
- 127 E Lynnwood St
- 1852 S 2nd St
- 1009 S 4th St Unit 1013
- 1831 S Church St
- 909 Genesee St
- 102 W Brookdale St
- 939 S Filmore St
- 1865 Chapel Ave
- 907 S 4th St
- 617 W Cumberland St
- 1104 S 7th St
- 218 Priscilla St
- 320 E Paoli St
- 206 208 W Emaus Ave
- 815 S Fawn St
- 1600 W Hamilton #2
- 1610 Chapel Ave Unit 1614
- 218 W Federal St
- 1524 Chapel Ave
- 1616 Chapel Ave Unit 1620
- 1520 1522 Chapel Ave
- 215 W Lynnwood St
- 1520 Chapel Ave Unit 1522
- 224 W Federal St
- 221 W Lynnwood St
- 1622 Chapel Ave Unit 1624
- 1520 S 2nd St Unit 1524
- 1516 Chapel Ave
- 221 W Federal St
- 217 W Federal St Unit 223
- 158 W Federal St
- 225 W Lynnwood St Unit 231
- 232 W Federal St
- 1512 Chapel Ave
- 227 W Federal St