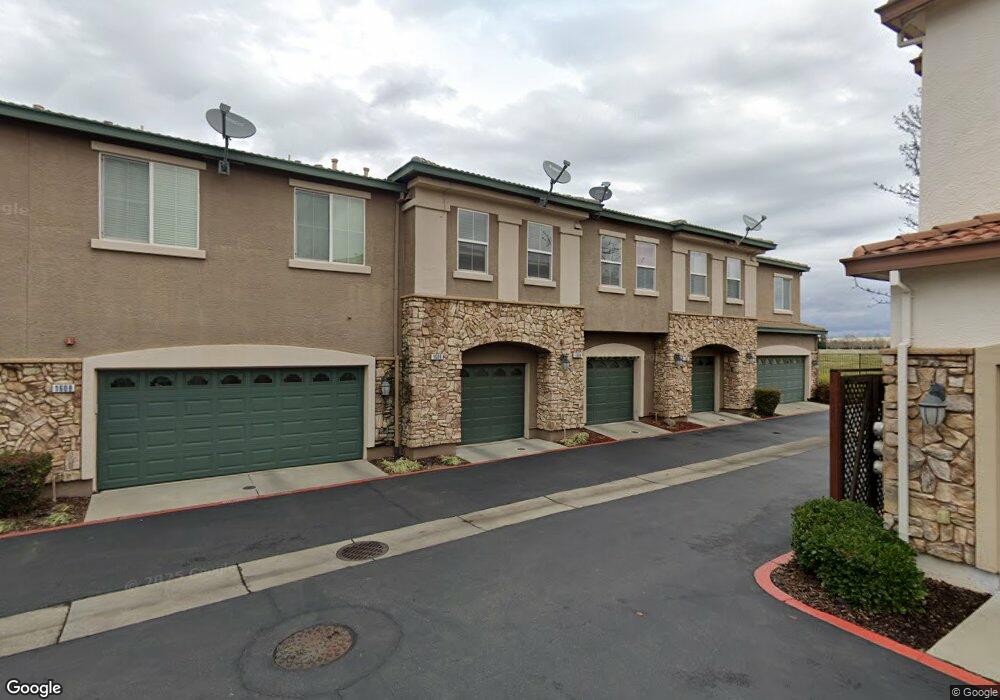
1602 Hudson Cir Unit 1602 Lincoln, CA 95648
Estimated Value: $373,234 - $432,000
2
Beds
3
Baths
1,151
Sq Ft
$350/Sq Ft
Est. Value
About This Home
This home is located at 1602 Hudson Cir Unit 1602, Lincoln, CA 95648 and is currently estimated at $402,809, approximately $349 per square foot. 1602 Hudson Cir Unit 1602 is a home located in Placer County with nearby schools including Foskett Ranch Elementary School, Glen Edwards Middle, and Lincoln High.
Ownership History
Date
Name
Owned For
Owner Type
Purchase Details
Closed on
Oct 18, 2019
Sold by
Bondarenko Yuriy and Bondarenko Melanie
Bought by
Kipperman Julia
Current Estimated Value
Home Financials for this Owner
Home Financials are based on the most recent Mortgage that was taken out on this home.
Original Mortgage
$207,000
Outstanding Balance
$181,342
Interest Rate
3.5%
Mortgage Type
New Conventional
Estimated Equity
$221,467
Purchase Details
Closed on
Jul 26, 2012
Sold by
Weiss Matthew
Bought by
Bondarenko Yuriy and Martynovich Melanie
Purchase Details
Closed on
Oct 15, 2007
Sold by
Western Pacific Housing Inc
Bought by
Weiss Matthew
Home Financials for this Owner
Home Financials are based on the most recent Mortgage that was taken out on this home.
Original Mortgage
$181,484
Interest Rate
6.27%
Mortgage Type
Purchase Money Mortgage
Create a Home Valuation Report for This Property
The Home Valuation Report is an in-depth analysis detailing your home's value as well as a comparison with similar homes in the area
Home Values in the Area
Average Home Value in this Area
Purchase History
| Date | Buyer | Sale Price | Title Company |
|---|---|---|---|
| Kipperman Julia | $276,000 | Calatlantic Title | |
| Bondarenko Yuriy | $97,000 | Placer Title Company | |
| Weiss Matthew | $227,000 | First American Title Company |
Source: Public Records
Mortgage History
| Date | Status | Borrower | Loan Amount |
|---|---|---|---|
| Open | Kipperman Julia | $207,000 | |
| Previous Owner | Weiss Matthew | $181,484 |
Source: Public Records
Tax History Compared to Growth
Tax History
| Year | Tax Paid | Tax Assessment Tax Assessment Total Assessment is a certain percentage of the fair market value that is determined by local assessors to be the total taxable value of land and additions on the property. | Land | Improvement |
|---|---|---|---|---|
| 2025 | $4,353 | $301,841 | $65,616 | $236,225 |
| 2023 | $4,353 | $290,122 | $63,069 | $227,053 |
| 2022 | $4,228 | $284,434 | $61,833 | $222,601 |
| 2021 | $4,145 | $278,858 | $60,621 | $218,237 |
| 2020 | $4,122 | $276,000 | $60,000 | $216,000 |
| 2019 | $2,222 | $107,074 | $16,557 | $90,517 |
| 2018 | $2,179 | $104,976 | $16,233 | $88,743 |
| 2017 | $2,129 | $102,918 | $15,915 | $87,003 |
| 2016 | $2,090 | $100,901 | $15,603 | $85,298 |
| 2015 | $2,055 | $99,386 | $15,369 | $84,017 |
| 2014 | $2,019 | $97,440 | $15,068 | $82,372 |
Source: Public Records
Map
Nearby Homes
- 3303 Leiper Loop
- 1004 Hudson Cir
- 1506 Hudson Cir
- 1204 Hudson Cir
- 2124 Donovan Dr
- 2140 Donovan Dr
- 1505 El Camino Verde Dr
- 1575 El Camino Verde Dr
- 2116 Abbeyhill Rd
- 1848 Talavera Dr
- Plan 1811 at Jasper
- Plan 1547 at Jasper
- Plan 2311 at Jasper
- Plan 1678 at Jasper
- 1673 Calabasa Dr
- 2470 Saint Andrews Dr
- 1983 Milan Way
- 1785 Newark Ct
- 1835 Larkflower Way
- 2616 Swallowview Dr
- 1600 Hudson Cir Unit 83
- 1600 Hudson Cir
- 1602 Hudson Cir
- 1604 Hudson Cir Unit N81
- 1606 Hudson Cir
- 1608 Hudson Cir Unit 79
- 1608 Hudson Cir
- 1510 Hudson Cir
- 3011 Leiper Loop
- 3009 Leiper Loop Unit 76
- 3007 Leiper Loop Unit 75
- 3007 Leiper Loop
- 1612 Hudson Cir
- 3003 Leiper Loop
- 3001 Leiper Loop
- 1502 Hudson Circle Lot##88
- 3101 Leiper Loop
- 1405 Hudson Cir Unit 105
- 3103 Leiper Loop Unit 34
- 3103 Leiper Loop