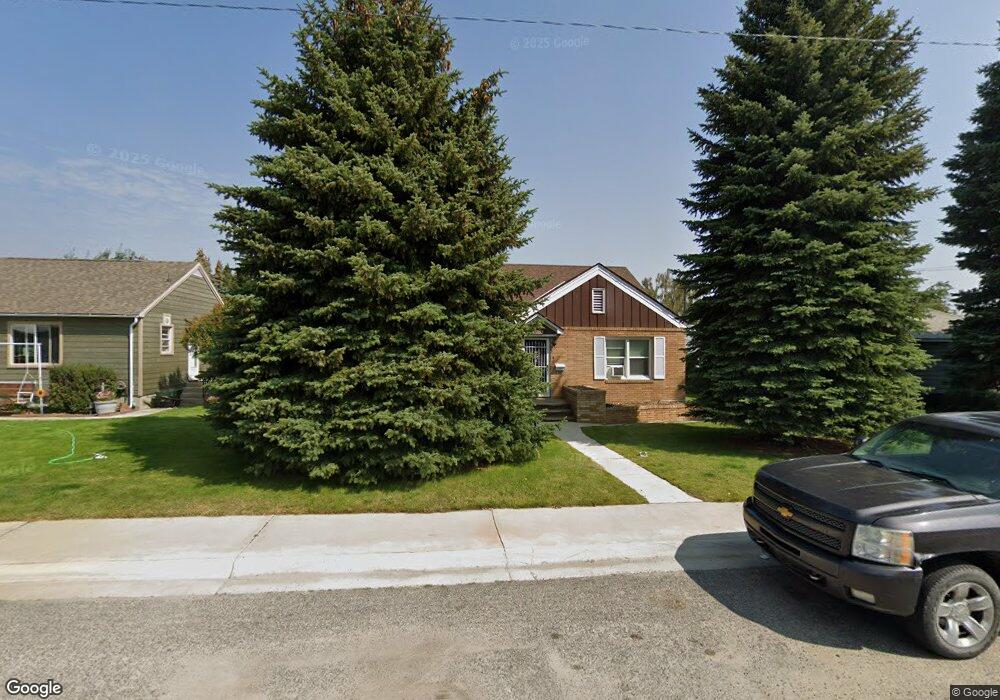
1602 Tammany St Anaconda, MT 59711
Estimated Value: $202,000 - $363,000
4
Beds
2
Baths
1,592
Sq Ft
$198/Sq Ft
Est. Value
About This Home
This home is located at 1602 Tammany St, Anaconda, MT 59711 and is currently estimated at $314,842, approximately $197 per square foot. 1602 Tammany St is a home located in Deer Lodge County with nearby schools including Lincoln Elementary School, Fred Moodry Intermediate School, and Anaconda Junior High School.
Ownership History
Date
Name
Owned For
Owner Type
Purchase Details
Closed on
Jul 12, 2024
Sold by
Smelter City Estates Llc
Bought by
Davies Roger and Davies Michelle
Current Estimated Value
Purchase Details
Closed on
Oct 20, 2023
Sold by
Howard Alan V and Howard Christina K
Bought by
Ferguson Colten J and Ferguson Makayla L
Home Financials for this Owner
Home Financials are based on the most recent Mortgage that was taken out on this home.
Original Mortgage
$292,929
Interest Rate
7.12%
Mortgage Type
FHA
Purchase Details
Closed on
Aug 18, 2020
Sold by
Bolkovatz Jean A and Elbert James P
Bought by
Howard Alan V and Howard Christina K
Home Financials for this Owner
Home Financials are based on the most recent Mortgage that was taken out on this home.
Original Mortgage
$186,868
Interest Rate
3%
Mortgage Type
New Conventional
Create a Home Valuation Report for This Property
The Home Valuation Report is an in-depth analysis detailing your home's value as well as a comparison with similar homes in the area
Home Values in the Area
Average Home Value in this Area
Purchase History
| Date | Buyer | Sale Price | Title Company |
|---|---|---|---|
| Davies Roger | -- | Flying S Title | |
| Ferguson Colten J | -- | Flying S Title And Escrow Of M | |
| Howard Alan V | -- | First American Title Company |
Source: Public Records
Mortgage History
| Date | Status | Borrower | Loan Amount |
|---|---|---|---|
| Previous Owner | Ferguson Colten J | $292,929 | |
| Previous Owner | Ferguson Colten J | $6,000 | |
| Previous Owner | Howard Alan V | $186,868 |
Source: Public Records
Tax History Compared to Growth
Tax History
| Year | Tax Paid | Tax Assessment Tax Assessment Total Assessment is a certain percentage of the fair market value that is determined by local assessors to be the total taxable value of land and additions on the property. | Land | Improvement |
|---|---|---|---|---|
| 2025 | $1,659 | $337,700 | $0 | $0 |
| 2024 | $2,870 | $272,900 | $0 | $0 |
| 2023 | $2,997 | $323,600 | $0 | $0 |
| 2022 | $2,611 | $198,100 | $0 | $0 |
| 2021 | $1,945 | $177,500 | $0 | $0 |
| 2020 | $2,383 | $172,900 | $0 | $0 |
| 2019 | $2,505 | $172,900 | $0 | $0 |
| 2018 | $2,414 | $166,700 | $0 | $0 |
| 2017 | $1,800 | $166,700 | $0 | $0 |
| 2016 | $2,190 | $148,300 | $0 | $0 |
| 2015 | $1,718 | $148,300 | $0 | $0 |
| 2014 | $1,290 | $63,017 | $0 | $0 |
Source: Public Records
Map
Nearby Homes
- 306 Juniper St
- 120 Juniper St
- 1812 Ogden St
- 120 Balsam St
- 1919 W Park Ave
- 903 W 3rd St
- 2002 W Park Ave
- 722 W Park Ave
- 418 Evergreen St
- 2102 Lincoln St
- 2105 Lincoln St
- 504 Pine St
- 516 W Park Ave
- 104 & 106 Elm St
- 523 Elm St
- 411 W 7th St
- 415 W 6th St
- 200 Hickory St Unit 23
- 200 Hickory St Unit 12
- 706 Locust St
- 1600 Tammany St
- 1604 Tammany St
- 220 Larch St
- 1606 Tammany St
- 1603 W Park Ave
- 1601 W Park Ave
- 1605 W Park Ave
- 1608 Tammany St
- 1607 W Park Ave
- 1609 W Park Ave
- 1610 Tammany St
- 1525 W Park Ave
- 1611 W Park Ave
- 1612 Tammany St
- 1613 W Park Ave
- 1614 Tammany St
- 1602 W Park Ave
- TBD Copper Rd
- 1602 W Park Ave
- 120 Larch St