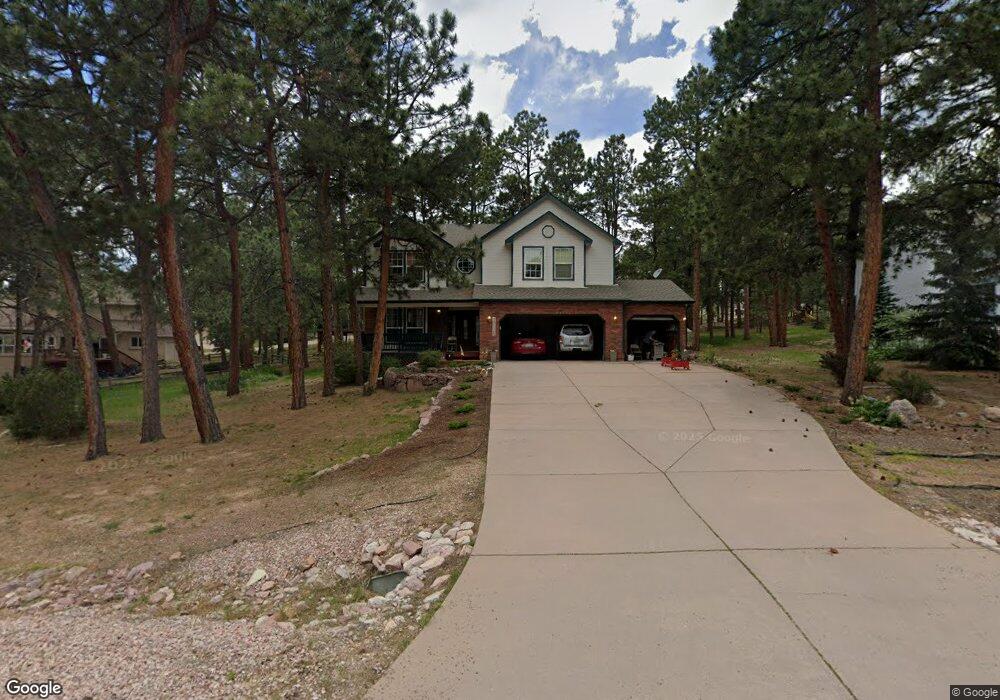
16026 Red Fox Ln Colorado Springs, CO 80921
Fox Run NeighborhoodEstimated Value: $820,943 - $885,000
5
Beds
4
Baths
2,383
Sq Ft
$357/Sq Ft
Est. Value
About This Home
This home is located at 16026 Red Fox Ln, Colorado Springs, CO 80921 and is currently estimated at $851,236, approximately $357 per square foot. 16026 Red Fox Ln is a home located in El Paso County with nearby schools including Ray E Kilmer Elementary School, Lewis-Palmer Middle School, and Lewis-Palmer High School.
Ownership History
Date
Name
Owned For
Owner Type
Purchase Details
Closed on
Jun 8, 2010
Sold by
King Stephen C and King Mary L
Bought by
King Stephen C and King Mary L
Current Estimated Value
Purchase Details
Closed on
Jun 21, 2001
Sold by
Hanley Brian J and Hanley Terry M
Bought by
King Stephen C and King Mary L
Home Financials for this Owner
Home Financials are based on the most recent Mortgage that was taken out on this home.
Original Mortgage
$345,600
Outstanding Balance
$131,069
Interest Rate
7.08%
Mortgage Type
Purchase Money Mortgage
Estimated Equity
$720,167
Purchase Details
Closed on
Nov 30, 1999
Sold by
Ashcroft Homes Inc
Bought by
Hanley Brian J and Hanley Terry M
Home Financials for this Owner
Home Financials are based on the most recent Mortgage that was taken out on this home.
Original Mortgage
$215,000
Interest Rate
7.93%
Purchase Details
Closed on
Apr 30, 1999
Sold by
The Ridge At Fox Run Llc
Bought by
Ashcroft Homes Inc
Create a Home Valuation Report for This Property
The Home Valuation Report is an in-depth analysis detailing your home's value as well as a comparison with similar homes in the area
Home Values in the Area
Average Home Value in this Area
Purchase History
| Date | Buyer | Sale Price | Title Company |
|---|---|---|---|
| King Stephen C | -- | None Available | |
| King Stephen C | $384,000 | First American | |
| Hanley Brian J | $309,300 | Stewart Title | |
| Ashcroft Homes Inc | $115,500 | Security Title |
Source: Public Records
Mortgage History
| Date | Status | Borrower | Loan Amount |
|---|---|---|---|
| Open | King Stephen C | $345,600 | |
| Previous Owner | Hanley Brian J | $215,000 |
Source: Public Records
Tax History Compared to Growth
Tax History
| Year | Tax Paid | Tax Assessment Tax Assessment Total Assessment is a certain percentage of the fair market value that is determined by local assessors to be the total taxable value of land and additions on the property. | Land | Improvement |
|---|---|---|---|---|
| 2025 | $4,343 | $57,020 | -- | -- |
| 2024 | $3,648 | $53,630 | $12,780 | $40,850 |
| 2022 | $3,215 | $43,090 | $11,050 | $32,040 |
| 2021 | $3,322 | $44,330 | $11,370 | $32,960 |
| 2020 | $2,959 | $39,230 | $9,870 | $29,360 |
| 2019 | $2,948 | $39,230 | $9,870 | $29,360 |
| 2018 | $2,663 | $34,990 | $9,070 | $25,920 |
| 2017 | $2,663 | $34,990 | $9,070 | $25,920 |
| 2016 | $2,716 | $37,780 | $10,030 | $27,750 |
| 2015 | $2,714 | $37,780 | $10,030 | $27,750 |
| 2014 | $2,641 | $35,980 | $10,030 | $25,950 |
Source: Public Records
Map
Nearby Homes
- 15848 Woodmeadow Ct
- 16150 Cliffrock Ct
- 16231 Thunder Cat Way
- 15765 Pineycove Ct
- 15655 Falcon Ridge Ct
- 15595 Falcon Ridge Ct
- 1797 Summerglow Ln
- 16445 Mountain Glory Dr
- 1734 Summerglow Ln
- 16428 Mountain Glory Dr
- 1621 Lazy Cat Ln
- 1070 Panoramic Dr
- 1706 Catnap Ln
- 1716 Catnap Ln
- 1325 Deby Place
- 16496 Florawood Place
- 630 Celtic Ct
- 1320 Spring Valley Dr
- 17552 Colonial Park Dr
- 15090 Ridgefield Ln
- 16044 Red Fox Ln
- 15917 Woodmeadow Ct
- 16043 Red Fox Ln
- 15953 Woodmeadow Ct
- 16025 Red Fox Ln
- 16062 Red Fox Ln
- 16061 Red Fox Ln
- 16079 Red Fox Ln
- 15835 Woodmeadow Ct
- 15971 Woodmeadow Ct
- 15936 Woodmeadow Ct
- 15918 Woodmeadow Ct
- 1516 Snowpeak Ct
- 15847 Woodmeadow Ct
- 15954 Woodmeadow Ct
- 1515 Snowpeak Ct
- 15972 Woodmeadow Ct
- 15823 Woodmeadow Ct
- 15884 Woodmeadow Ct
- 16097 Red Fox Ln