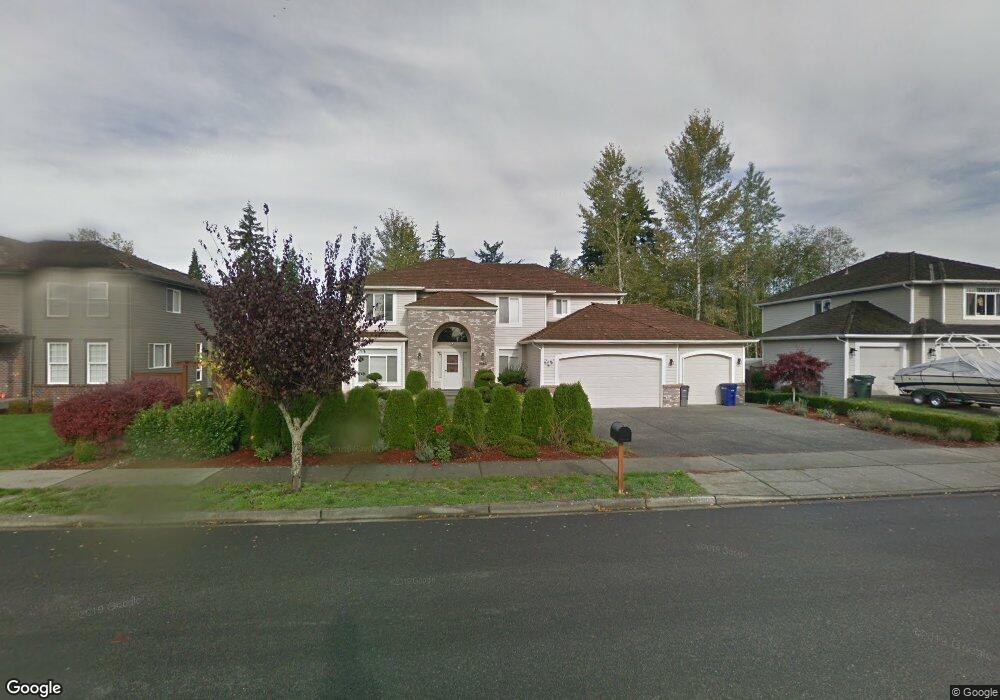
1603 242nd St SE Bothell, WA 98021
Canyon Park NeighborhoodEstimated Value: $1,428,000 - $1,506,000
3
Beds
3
Baths
2,856
Sq Ft
$510/Sq Ft
Est. Value
About This Home
This home is located at 1603 242nd St SE, Bothell, WA 98021 and is currently estimated at $1,456,035, approximately $509 per square foot. 1603 242nd St SE is a home with nearby schools including Maywood Hills Elementary School, Canyon Park Junior High School, and Bothell High School.
Ownership History
Date
Name
Owned For
Owner Type
Purchase Details
Closed on
Sep 14, 2005
Sold by
Ahmad Kabir and Chishty Mohammad Afzal
Bought by
Wang Shu Fen and Hsiao Hung Chuan
Current Estimated Value
Purchase Details
Closed on
Nov 19, 2004
Sold by
Chishty Shamim Afzal
Bought by
Chishty Mohammad Afzal
Home Financials for this Owner
Home Financials are based on the most recent Mortgage that was taken out on this home.
Original Mortgage
$352,800
Interest Rate
5%
Mortgage Type
Purchase Money Mortgage
Purchase Details
Closed on
Jun 17, 1999
Sold by
Lansing Douglas P and Lansing Jill A
Bought by
Samels Jason L
Home Financials for this Owner
Home Financials are based on the most recent Mortgage that was taken out on this home.
Original Mortgage
$242,000
Interest Rate
6.75%
Create a Home Valuation Report for This Property
The Home Valuation Report is an in-depth analysis detailing your home's value as well as a comparison with similar homes in the area
Home Values in the Area
Average Home Value in this Area
Purchase History
| Date | Buyer | Sale Price | Title Company |
|---|---|---|---|
| Wang Shu Fen | $557,000 | First American Title Ins Co | |
| Chishty Mohammad Afzal | $11,235 | First American Title Ins Co | |
| Samels Jason L | $364,950 | Evergreen Title Company Inc |
Source: Public Records
Mortgage History
| Date | Status | Borrower | Loan Amount |
|---|---|---|---|
| Previous Owner | Chishty Mohammad Afzal | $352,800 | |
| Previous Owner | Samels Jason L | $242,000 |
Source: Public Records
Tax History
| Year | Tax Paid | Tax Assessment Tax Assessment Total Assessment is a certain percentage of the fair market value that is determined by local assessors to be the total taxable value of land and additions on the property. | Land | Improvement |
|---|---|---|---|---|
| 2025 | $9,363 | $1,309,700 | $745,000 | $564,700 |
| 2024 | $9,363 | $1,123,000 | $651,000 | $472,000 |
| 2023 | $9,914 | $1,300,200 | $755,000 | $545,200 |
| 2022 | $8,871 | $938,400 | $470,000 | $468,400 |
| 2020 | $8,377 | $822,300 | $425,000 | $397,300 |
| 2019 | $7,308 | $743,200 | $345,000 | $398,200 |
| 2018 | $6,689 | $655,400 | $300,000 | $355,400 |
| 2017 | $5,862 | $581,400 | $250,000 | $331,400 |
| 2016 | $5,249 | $537,500 | $220,000 | $317,500 |
Source: Public Records
Map
Nearby Homes
- 1404 241st Place SE
- 24225 13th Ave SE
- 24225 13th Ave SE Unit CR28
- 24233 13th Ave SE
- 24233 13th Ave SE Unit CR26
- 24237 13th Ave SE
- 24237 13th Ave SE Unit CR25
- 24229 13th Ave SE Unit CR27
- 24229 13th Ave SE
- 24319 13th Ave SE
- 1725 242nd St SE Unit 203
- 1725 242nd St SE Unit 238
- 24323 13th Ave SE
- 24323 13th Ave SE Unit CR20
- 23835 15th Ave SE Unit 40
- 24327 13th Ave SE
- 24327 13th Ave SE Unit CR19
- 1448 238th St SE
- 23825 15th Ave SE Unit 71
- 23825 15th Ave SE Unit 311
- 1611 242nd St SE
- 1601 242nd St SE
- 24123 16th Ave SE
- 24117 16th Ave SE
- 24201 16th Place SE
- 24200 16th Place SE
- 1711 242nd St SE
- 1707 242nd St SE
- 1515 242nd St SE
- 24122 16th Ave SE
- 24111 16th Ave SE
- 1703 242nd St SE
- 24207 16th Place SE
- 24206 16th Place SE
- 24114 16th Ave SE
- 24105 16th Ave SE
- 24207 15th Place SE
- 24213 15th Place SE
- 1509 242nd St SE
- 24213 16th Place SE
Your Personal Tour Guide
Ask me questions while you tour the home.