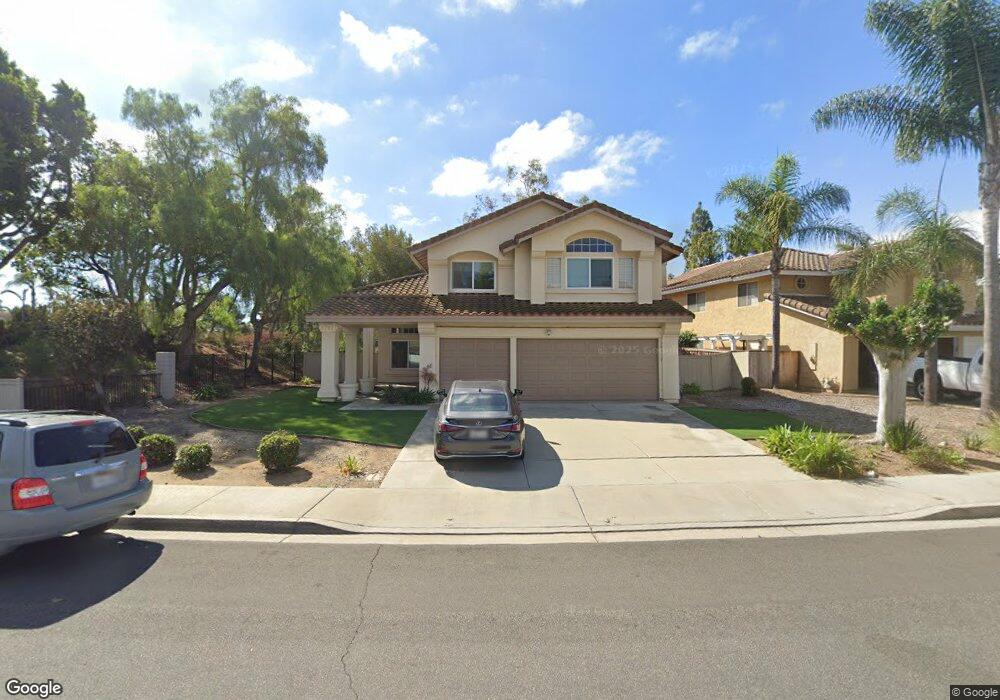
1603 Dawson Dr Vista, CA 92081
Shadowridge NeighborhoodEstimated Value: $1,134,386 - $1,220,000
4
Beds
3
Baths
2,667
Sq Ft
$438/Sq Ft
Est. Value
About This Home
This home is located at 1603 Dawson Dr, Vista, CA 92081 and is currently estimated at $1,169,097, approximately $438 per square foot. 1603 Dawson Dr is a home located in San Diego County with nearby schools including Lake Elementary School, Madison Middle School, and Rancho Buena Vista High School.
Ownership History
Date
Name
Owned For
Owner Type
Purchase Details
Closed on
Jun 28, 2019
Sold by
Kim Charles Mun Chol
Bought by
Song Kim Sang Hyon and Song Kim Wol
Current Estimated Value
Purchase Details
Closed on
Jan 31, 2003
Sold by
Kim Sang Hyon and Kim Wol Song
Bought by
Kim Sang Hyon and Kim Wol Song
Purchase Details
Closed on
Jun 13, 1997
Sold by
Chol Kim Charles Mun
Bought by
Kim Sang Hyon and Kim Wol Song
Home Financials for this Owner
Home Financials are based on the most recent Mortgage that was taken out on this home.
Original Mortgage
$130,000
Interest Rate
7.58%
Purchase Details
Closed on
Mar 17, 1994
Sold by
Meeker Development Company
Bought by
Kim Charles Mun Chol
Home Financials for this Owner
Home Financials are based on the most recent Mortgage that was taken out on this home.
Original Mortgage
$188,000
Interest Rate
5.25%
Create a Home Valuation Report for This Property
The Home Valuation Report is an in-depth analysis detailing your home's value as well as a comparison with similar homes in the area
Home Values in the Area
Average Home Value in this Area
Purchase History
| Date | Buyer | Sale Price | Title Company |
|---|---|---|---|
| Song Kim Sang Hyon | -- | None Available | |
| Kim Charles Mun Chol | -- | None Available | |
| Kim Sang Hyon | -- | -- | |
| Kim Sang Hyon | $230,000 | Commonwealth Land Title Co | |
| Kim Charles Mun Chol | $238,000 | Chicago Title |
Source: Public Records
Mortgage History
| Date | Status | Borrower | Loan Amount |
|---|---|---|---|
| Previous Owner | Kim Sang Hyon | $130,000 | |
| Previous Owner | Kim Charles Mun Chol | $188,000 |
Source: Public Records
Tax History Compared to Growth
Tax History
| Year | Tax Paid | Tax Assessment Tax Assessment Total Assessment is a certain percentage of the fair market value that is determined by local assessors to be the total taxable value of land and additions on the property. | Land | Improvement |
|---|---|---|---|---|
| 2025 | $4,713 | $367,229 | $138,865 | $228,364 |
| 2024 | $4,713 | $360,030 | $136,143 | $223,887 |
| 2023 | $4,618 | $352,972 | $133,474 | $219,498 |
| 2022 | $4,607 | $346,052 | $130,857 | $215,195 |
| 2021 | $4,508 | $339,268 | $128,292 | $210,976 |
| 2020 | $4,480 | $335,790 | $126,977 | $208,813 |
| 2019 | $4,419 | $329,207 | $124,488 | $204,719 |
| 2018 | $4,239 | $322,753 | $122,048 | $200,705 |
| 2017 | $4,174 | $316,425 | $119,655 | $196,770 |
| 2016 | $4,079 | $310,221 | $117,309 | $192,912 |
| 2015 | $4,055 | $305,562 | $115,547 | $190,015 |
| 2014 | $3,961 | $299,577 | $113,284 | $186,293 |
Source: Public Records
Map
Nearby Homes
- 1632 Mountain Pass Cir
- 1685 Mountain Pass Cir
- 2244 Eastbrook Rd
- 2225 Baxter Canyon Rd
- 1533 Harbor Dr
- 0 Green Oak Rd
- 2027 Harmony Way
- 2056 White Birch Dr
- 1916 Rosewood St
- 1930 Rosewood St
- 1829 Shadowood Cir
- 2436 Links Way
- 2042 Redwood Crest
- 1205 Columbus Way
- 954 Sheffield Dr
- 1060 Kendale Way
- 911 Concord Ct
- 1091 Shadowridge Dr Unit 114
- 1065 Brewley Ln
- 1449 Genoa Dr
- 1607 Dawson Dr
- 1611 Dawson Dr
- 1606 Dawson Dr
- 1602 Dawson Dr
- 1610 Dawson Dr
- 2156 Opal Ridge
- 2154 Opal Ridge
- 1614 Dawson Dr
- 2152 Opal Ridge
- 0 Dawson Dr
- 2150 Opal Ridge
- 2158 Opal Ridge
- 2148 Opal Ridge
- 2160 Opal Ridge
- 2146 Opal Ridge
- 1615 Dawson Dr
- 2162 Opal Ridge
- 2144 Opal Ridge
- 1597 Dawson Dr
- 1573 Pearl Heights Rd