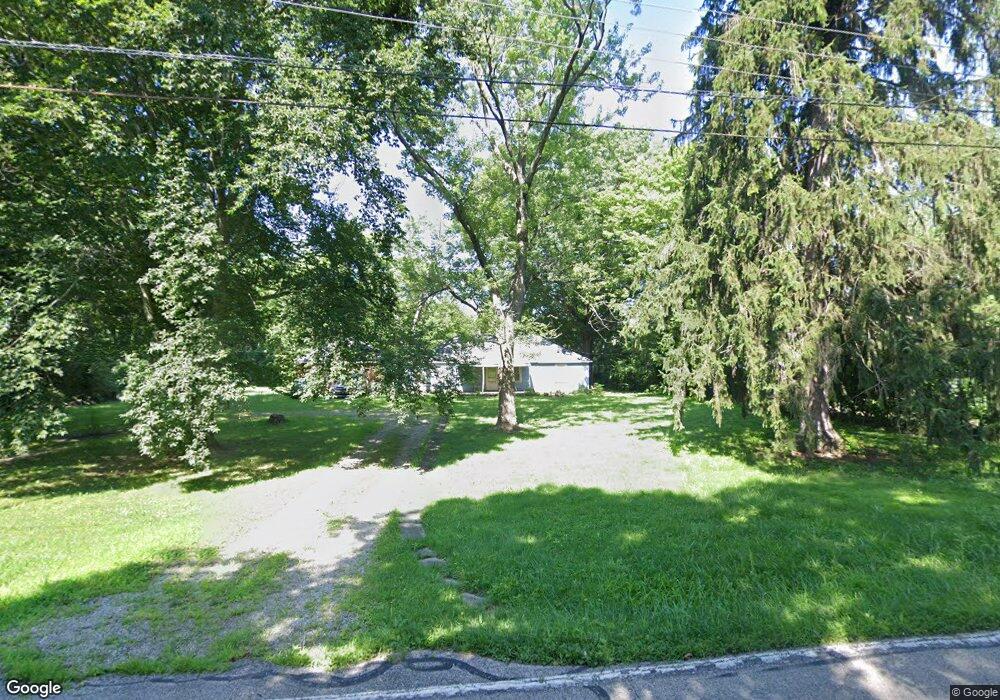
1603 S Snyder Rd New Lebanon, OH 45345
Estimated Value: $144,000 - $244,000
3
Beds
1
Bath
768
Sq Ft
$232/Sq Ft
Est. Value
About This Home
This home is located at 1603 S Snyder Rd, New Lebanon, OH 45345 and is currently estimated at $178,408, approximately $232 per square foot. 1603 S Snyder Rd is a home located in Montgomery County with nearby schools including Blairwood Elementary School and Jefferson High School.
Ownership History
Date
Name
Owned For
Owner Type
Purchase Details
Closed on
Sep 20, 2022
Sold by
Tomlincon Kacy and Tomlincon Kelley
Bought by
Tomlinson Kacy and Tomlinson Kelley
Current Estimated Value
Purchase Details
Closed on
Jun 19, 2007
Sold by
Cross Steve
Bought by
Cross Steve and Canegali Kacy
Home Financials for this Owner
Home Financials are based on the most recent Mortgage that was taken out on this home.
Original Mortgage
$80,000
Interest Rate
6.37%
Mortgage Type
Stand Alone First
Purchase Details
Closed on
Aug 30, 2004
Sold by
Davis Stephanie and Davis Tony
Bought by
Cross Steve
Home Financials for this Owner
Home Financials are based on the most recent Mortgage that was taken out on this home.
Original Mortgage
$72,000
Interest Rate
8.62%
Mortgage Type
Fannie Mae Freddie Mac
Purchase Details
Closed on
Jan 15, 2002
Sold by
Tokodi Stephanie N and Davis Stephanie
Bought by
Davis Stephanie
Create a Home Valuation Report for This Property
The Home Valuation Report is an in-depth analysis detailing your home's value as well as a comparison with similar homes in the area
Home Values in the Area
Average Home Value in this Area
Purchase History
| Date | Buyer | Sale Price | Title Company |
|---|---|---|---|
| Tomlinson Kacy | -- | -- | |
| Cross Steve | -- | Attorney | |
| Cross Steve | $72,000 | None Available | |
| Davis Stephanie | -- | Transcontinental Title Compa |
Source: Public Records
Mortgage History
| Date | Status | Borrower | Loan Amount |
|---|---|---|---|
| Previous Owner | Cross Steve | $80,000 | |
| Previous Owner | Cross Steve | $72,000 |
Source: Public Records
Tax History Compared to Growth
Tax History
| Year | Tax Paid | Tax Assessment Tax Assessment Total Assessment is a certain percentage of the fair market value that is determined by local assessors to be the total taxable value of land and additions on the property. | Land | Improvement |
|---|---|---|---|---|
| 2024 | $1,669 | $22,340 | $8,260 | $14,080 |
| 2023 | $1,669 | $22,340 | $8,260 | $14,080 |
| 2022 | $1,828 | $20,680 | $7,640 | $13,040 |
| 2021 | $1,826 | $20,680 | $7,640 | $13,040 |
| 2020 | $1,819 | $20,680 | $7,640 | $13,040 |
| 2019 | $1,788 | $18,920 | $7,640 | $11,280 |
| 2018 | $1,676 | $18,920 | $7,640 | $11,280 |
| 2017 | $1,662 | $18,920 | $7,640 | $11,280 |
| 2016 | $1,601 | $18,380 | $6,370 | $12,010 |
| 2015 | $1,428 | $18,380 | $6,370 | $12,010 |
| 2014 | $1,428 | $18,380 | $6,370 | $12,010 |
| 2012 | -- | $22,420 | $5,100 | $17,320 |
Source: Public Records
Map
Nearby Homes
- 7136 Dayton Liberty Rd
- 6900 Derby Rd
- 8620 W 3rd St
- 7166 Dayton Farmersville Rd
- 3232 Liberty Ellerton Rd
- 6940 Ellen Dr
- 217 Parsons Ave
- 201 Parsons Ave
- 1415 Olt Rd
- 2488 Olt Rd
- 0 Meeker Woods Unit 884863
- 1833 Guntle Rd
- 51 N Northampton Ave
- 6020 Germantown Pike
- 2445 Infirmary Rd
- 5342 Tucson Dr
- 5396 Dushore Dr
- 5082 Derby Rd
- 10849 Mile Rd
- 163 Drexel Ave
- 1585 S Snyder Rd
- 1668 S Snyder Rd
- 1636 S Snyder Rd
- 1584 S Snyder Rd
- 1582 S Snyder Rd
- 1578 S Snyder Rd
- 7983 Dayton Liberty Rd
- 8051 Forney Rd
- 1577 S Snyder Rd
- 7951 Dayton Liberty Rd
- 7951 Dayton Liberty Rd Unit LIBERTY
- 8189 Forney Rd
- 7951 Dayton Liberty Rd
- 7975 Dayton Liberty Rd
- 7915 Dayton Liberty Rd
- 7815 Longbourne St
- 7859 Dayton Liberty Rd
- 7843 Dayton Liberty Rd
- 1605 Liberty Ellerton Rd
- 1643 Liberty Ellerton Rd