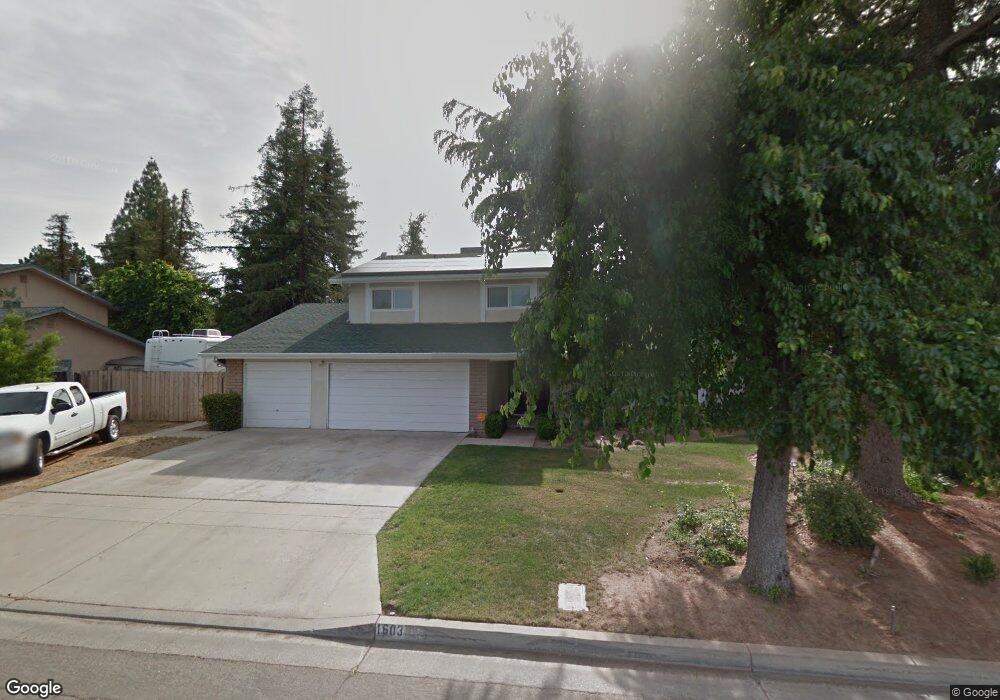
1603 S Sylmar Ave Fresno, CA 93727
Sunnyside NeighborhoodEstimated Value: $435,000 - $491,000
4
Beds
3
Baths
2,122
Sq Ft
$217/Sq Ft
Est. Value
About This Home
This home is located at 1603 S Sylmar Ave, Fresno, CA 93727 and is currently estimated at $461,412, approximately $217 per square foot. 1603 S Sylmar Ave is a home located in Fresno County with nearby schools including Elizabeth Terronez Middle School and Sunnyside High School.
Ownership History
Date
Name
Owned For
Owner Type
Purchase Details
Closed on
Feb 16, 2023
Sold by
Pitman Roger D and Pitman Dawn L
Bought by
Pitman Living Trust
Current Estimated Value
Purchase Details
Closed on
Mar 16, 2010
Sold by
Wells Fargo Bank Na
Bought by
Pitman Roger D and Pitman Dawn L
Home Financials for this Owner
Home Financials are based on the most recent Mortgage that was taken out on this home.
Original Mortgage
$144,000
Interest Rate
4.91%
Mortgage Type
New Conventional
Purchase Details
Closed on
Jan 22, 2010
Sold by
Thao Albert P and Thao Brenda B
Bought by
Wells Fargo Bank Na
Home Financials for this Owner
Home Financials are based on the most recent Mortgage that was taken out on this home.
Original Mortgage
$144,000
Interest Rate
4.91%
Mortgage Type
New Conventional
Purchase Details
Closed on
May 2, 2000
Sold by
Shahinian John K and Shahinian Yevnig E
Bought by
Thao Albert P and Thao Brenda B
Home Financials for this Owner
Home Financials are based on the most recent Mortgage that was taken out on this home.
Original Mortgage
$120,315
Interest Rate
8.25%
Mortgage Type
FHA
Create a Home Valuation Report for This Property
The Home Valuation Report is an in-depth analysis detailing your home's value as well as a comparison with similar homes in the area
Home Values in the Area
Average Home Value in this Area
Purchase History
| Date | Buyer | Sale Price | Title Company |
|---|---|---|---|
| Pitman Living Trust | -- | -- | |
| Pitman Roger D | $180,000 | Chicago Title Company | |
| Wells Fargo Bank Na | $161,000 | Accommodation | |
| Thao Albert P | $122,000 | Stewart Title |
Source: Public Records
Mortgage History
| Date | Status | Borrower | Loan Amount |
|---|---|---|---|
| Previous Owner | Pitman Roger D | $144,000 | |
| Previous Owner | Thao Albert P | $120,315 |
Source: Public Records
Tax History Compared to Growth
Tax History
| Year | Tax Paid | Tax Assessment Tax Assessment Total Assessment is a certain percentage of the fair market value that is determined by local assessors to be the total taxable value of land and additions on the property. | Land | Improvement |
|---|---|---|---|---|
| 2025 | $2,912 | $232,337 | $58,081 | $174,256 |
| 2023 | $2,856 | $223,318 | $55,827 | $167,491 |
| 2022 | $2,817 | $218,940 | $54,733 | $164,207 |
| 2021 | $2,740 | $214,648 | $53,660 | $160,988 |
| 2020 | $2,728 | $212,448 | $53,110 | $159,338 |
| 2019 | $2,623 | $208,283 | $52,069 | $156,214 |
| 2018 | $2,567 | $204,200 | $51,049 | $153,151 |
| 2017 | $2,522 | $200,198 | $50,049 | $150,149 |
| 2016 | $2,439 | $196,273 | $49,068 | $147,205 |
| 2015 | $2,402 | $193,325 | $48,331 | $144,994 |
| 2014 | $2,355 | $189,539 | $47,385 | $142,154 |
Source: Public Records
Map
Nearby Homes
- 5221 E Townsend Ave
- 5238 E Townsend Ave
- 1816 S Caesar Ave
- 5173 E Audrie Ave
- 5161 E Audrie Ave
- 5157 E Audrie Ave
- 5145 E Audrie Ave
- 5125 E Audrie Ave
- 2163 S Terry Ave
- 2173 S Sylmar Ave
- 4985 E Butler Ave Unit 109
- 2170 S Sylmar Ave
- 5145 E Lane Ave Unit 252
- Plan 2148 at Peach Street - Edgewood at Peach Avenue
- Plan 2321 Modeled at Peach Street - Edgewood at Peach Avenue
- Plan 2628 at Peach Street - Edgewood at Peach Avenue
- Plan 1860 Modeled at Peach Street - Edgewood at Peach Avenue
- 2194 S Sylmar Ave
- Plan 2155 at Peach Street - Parkside at Peach Avenue
- Plan 1769 Modeled at Peach Street - Parkside at Peach Avenue
- 1567 S Sylmar Ave
- 1635 S Sylmar Ave
- 1602 S Karen Ave
- 1566 S Karen Ave
- 1634 S Karen Ave
- 1604 S Sylmar Ave
- 1564 S Sylmar Ave
- 1636 S Sylmar Ave
- 1535 S Sylmar Ave
- 1669 S Sylmar Ave
- 1536 S Karen Ave
- 1668 S Karen Ave
- 1534 S Sylmar Ave
- 1670 S Sylmar Ave
- 1603 S Bailey Ave
- 1593 S Karen Ave
- 1623 S Karen Ave
- 1569 S Bailey Ave
- 1705 S Sylmar Ave
- 1631 S Bailey Ave