1603 W Ainslie St Unit 16032 Chicago, IL 60640
Ravenswood NeighborhoodEstimated Value: $190,000 - $316,000
--
Bed
--
Bath
800
Sq Ft
$293/Sq Ft
Est. Value
About This Home
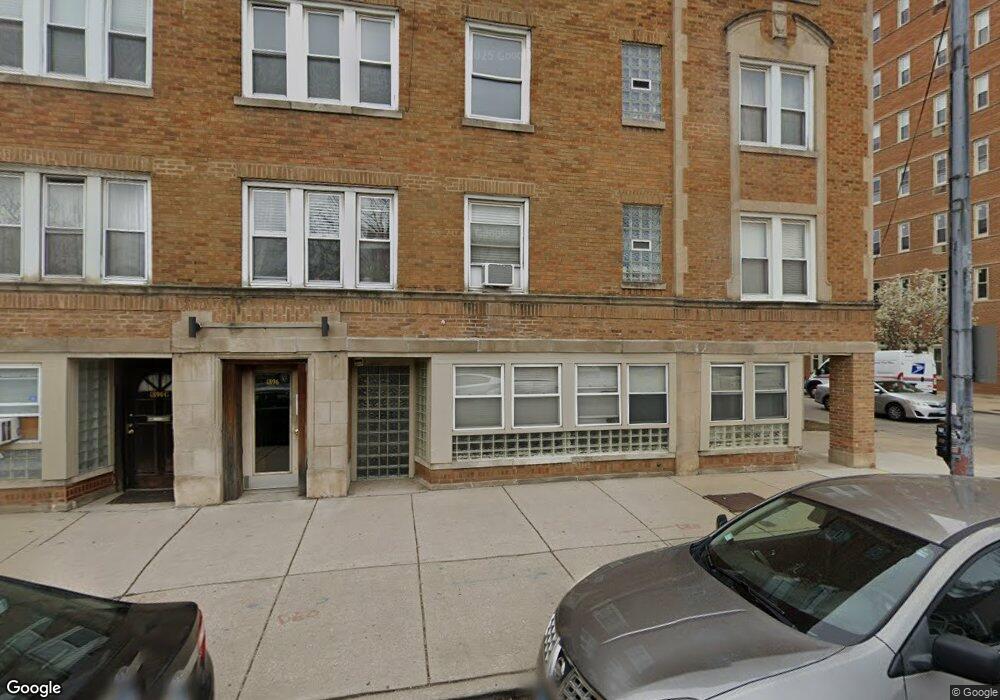
This home is located at 1603 W Ainslie St Unit 16032, Chicago, IL 60640 and is currently estimated at $234,152, approximately $292 per square foot. 1603 W Ainslie St Unit 16032 is a home located in Cook County with nearby schools including McPherson Elementary School, Amundsen High School, and Passages Elementary Charter School.
Ownership History
Date
Name
Owned For
Owner Type
Purchase Details
Closed on
Mar 28, 2007
Sold by
Ortega Axel and Ortega Ivia D
Bought by
Radakovich Heidi
Current Estimated Value
Home Financials for this Owner
Home Financials are based on the most recent Mortgage that was taken out on this home.
Original Mortgage
$165,200
Outstanding Balance
$100,159
Interest Rate
6.2%
Mortgage Type
Unknown
Estimated Equity
$133,993
Purchase Details
Closed on
Aug 8, 2003
Sold by
Ortiz Ivia D and Ortega Ivia D
Bought by
Ortega Axel and Ortega Ivia D
Home Financials for this Owner
Home Financials are based on the most recent Mortgage that was taken out on this home.
Original Mortgage
$108,800
Interest Rate
3.62%
Mortgage Type
Unknown
Purchase Details
Closed on
Dec 19, 1997
Sold by
Uptown National Bank Of Chicago
Bought by
Ortiz Ivia D
Home Financials for this Owner
Home Financials are based on the most recent Mortgage that was taken out on this home.
Original Mortgage
$55,950
Interest Rate
7.12%
Create a Home Valuation Report for This Property
The Home Valuation Report is an in-depth analysis detailing your home's value as well as a comparison with similar homes in the area
Home Values in the Area
Average Home Value in this Area
Purchase History
| Date | Buyer | Sale Price | Title Company |
|---|---|---|---|
| Radakovich Heidi | $170,500 | First American Title Ins Co | |
| Ortega Axel | -- | Residential Title Services | |
| Ortiz Ivia D | $56,500 | -- |
Source: Public Records
Mortgage History
| Date | Status | Borrower | Loan Amount |
|---|---|---|---|
| Open | Radakovich Heidi | $165,200 | |
| Previous Owner | Ortega Axel | $108,800 | |
| Previous Owner | Ortiz Ivia D | $55,950 |
Source: Public Records
Tax History Compared to Growth
Tax History
| Year | Tax Paid | Tax Assessment Tax Assessment Total Assessment is a certain percentage of the fair market value that is determined by local assessors to be the total taxable value of land and additions on the property. | Land | Improvement |
|---|---|---|---|---|
| 2024 | $2,254 | $14,905 | $3,416 | $11,489 |
| 2023 | $2,176 | $14,000 | $2,746 | $11,254 |
| 2022 | $2,176 | $14,000 | $2,746 | $11,254 |
| 2021 | $2,145 | $13,999 | $2,746 | $11,253 |
| 2020 | $1,851 | $11,413 | $1,647 | $9,766 |
| 2019 | $1,841 | $12,591 | $1,647 | $10,944 |
| 2018 | $1,809 | $12,591 | $1,647 | $10,944 |
| 2017 | $1,790 | $11,690 | $1,441 | $10,249 |
| 2016 | $1,841 | $11,690 | $1,441 | $10,249 |
| 2015 | $1,661 | $11,690 | $1,441 | $10,249 |
| 2014 | $1,827 | $12,416 | $1,107 | $11,309 |
| 2013 | $1,780 | $12,416 | $1,107 | $11,309 |
Source: Public Records
Map
Nearby Homes
- 4911 N Ashland Ave
- 4854 N Paulina St Unit 1W
- 4856 N Paulina St Unit 3W
- 5049 N Ashland Ave
- 4831 N Hermitage Ave Unit 3B
- 4831 N Hermitage 3b Ave
- 4846 N Hermitage Ave
- 1433 W Winnemac Ave
- 1457 W Carmen Ave Unit 3
- 1776 W Winnemac Ave Unit 100
- 1442 W Carmen Ave Unit 1
- 4717 N Paulina St
- 4700 N Ashland Ave Unit 6
- 4745 N Ravenswood Ave Unit 210
- 4745 N Ravenswood Ave Unit 113
- 4909 N Wolcott Ave Unit 2B
- 1716 W Leland Ave Unit 2F
- 4947 N Wolcott Ave Unit 1B
- 5013 N Wolcott Ave Unit 3W
- 1719 W Foster Ave
- 1605 W Ainslie St Unit 16053
- 1605 W Ainslie St Unit 16051
- 1605 W Ainslie St Unit 16052
- 1605 W Ainslie St Unit 3
- 1603 W Ainslie St Unit 16033
- 1603 W Ainslie St Unit 16031
- 1603 W Ainslie St Unit 1603G
- 1603 W Ainslie St Unit G
- 1603 W Ainslie St Unit 3
- 1603 W Ainslie St Unit 2
- 1603 W Ainslie St Unit G
- 1607 W Ainslie St Unit 2
- 1607 W Ainslie St Unit 16071
- 1607 W Ainslie St Unit 16073
- 1607 W Ainslie St Unit 16072
- 1607 W Ainslie St Unit 3
- 1607 W Ainslie St Unit 1
- 1601 W Ainslie St Unit 3W
- 4896 N Ashland Ave Unit 3W
- 4896 N Ashland Ave Unit 48962E