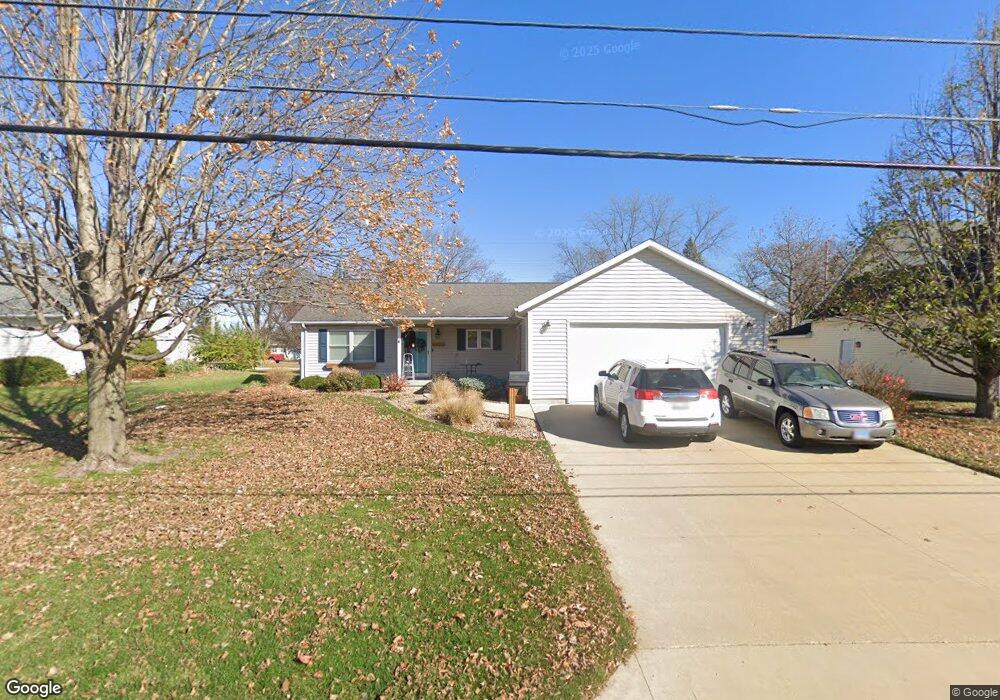
1603 W Main St Mendota, IL 61342
Estimated Value: $210,756 - $250,000
--
Bed
--
Bath
1,776
Sq Ft
$130/Sq Ft
Est. Value
About This Home
This home is located at 1603 W Main St, Mendota, IL 61342 and is currently estimated at $231,689, approximately $130 per square foot. 1603 W Main St is a home located in LaSalle County with nearby schools including Northbrook School, Lincoln Elementary School, and Blackstone Elementary School.
Ownership History
Date
Name
Owned For
Owner Type
Purchase Details
Closed on
Mar 17, 2021
Sold by
Kaufman Janice L
Bought by
Becker Michael R and Becker Wendy S
Current Estimated Value
Home Financials for this Owner
Home Financials are based on the most recent Mortgage that was taken out on this home.
Original Mortgage
$120,000
Outstanding Balance
$107,203
Interest Rate
2.5%
Mortgage Type
New Conventional
Estimated Equity
$124,486
Purchase Details
Closed on
Aug 30, 2005
Sold by
Abens James R and Michelsen David E
Bought by
Kaufman Janice L
Create a Home Valuation Report for This Property
The Home Valuation Report is an in-depth analysis detailing your home's value as well as a comparison with similar homes in the area
Home Values in the Area
Average Home Value in this Area
Purchase History
| Date | Buyer | Sale Price | Title Company |
|---|---|---|---|
| Becker Michael R | $165,000 | None Available | |
| Kaufman Janice L | $20,000 | None Available |
Source: Public Records
Mortgage History
| Date | Status | Borrower | Loan Amount |
|---|---|---|---|
| Open | Becker Michael R | $120,000 |
Source: Public Records
Tax History Compared to Growth
Tax History
| Year | Tax Paid | Tax Assessment Tax Assessment Total Assessment is a certain percentage of the fair market value that is determined by local assessors to be the total taxable value of land and additions on the property. | Land | Improvement |
|---|---|---|---|---|
| 2024 | $4,673 | $59,943 | $8,589 | $51,354 |
| 2023 | $4,355 | $55,824 | $7,999 | $47,825 |
| 2022 | $3,981 | $50,892 | $7,292 | $43,600 |
| 2021 | $3,933 | $48,175 | $6,903 | $41,272 |
| 2020 | $3,194 | $45,487 | $6,518 | $38,969 |
| 2019 | $3,240 | $44,706 | $6,518 | $38,188 |
| 2018 | $2,829 | $43,726 | $6,375 | $37,351 |
| 2017 | $3,255 | $43,173 | $6,294 | $36,879 |
| 2016 | $3,097 | $41,334 | $6,026 | $35,308 |
| 2015 | $2,983 | $40,079 | $5,843 | $34,236 |
| 2012 | -- | $45,905 | $6,693 | $39,212 |
Source: Public Records
Map
Nearby Homes