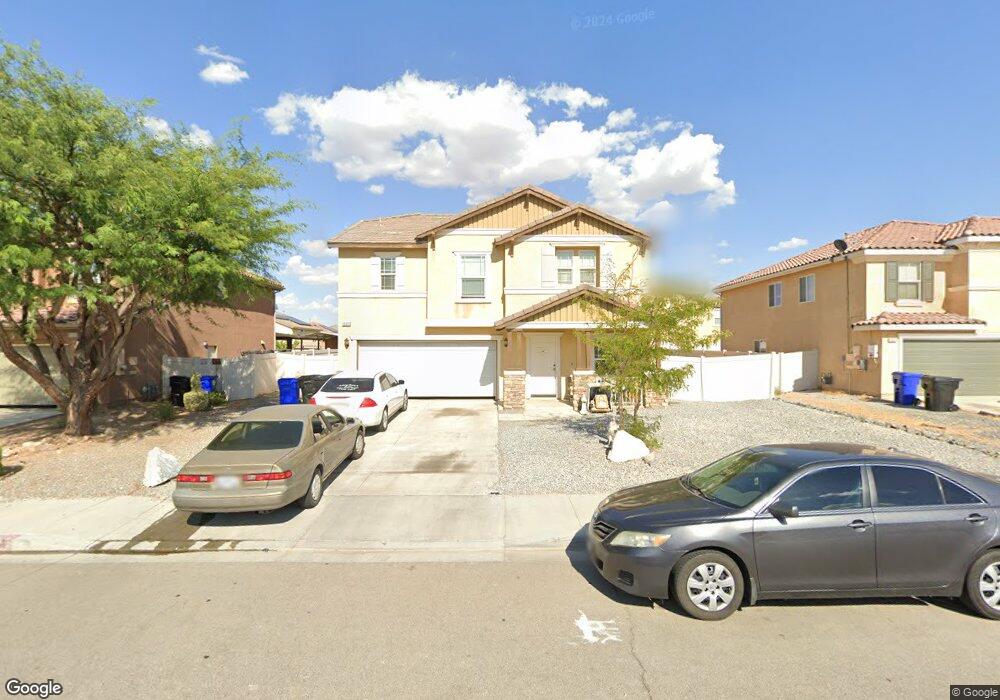
16031 Little Chief Ln Victorville, CA 92394
Estimated Value: $447,737 - $472,000
3
Beds
3
Baths
2,264
Sq Ft
$204/Sq Ft
Est. Value
About This Home
This home is located at 16031 Little Chief Ln, Victorville, CA 92394 and is currently estimated at $462,684, approximately $204 per square foot. 16031 Little Chief Ln is a home located in San Bernardino County with nearby schools including Challenger School Of Sports And Fitness, Village Elementary School, and Brentwood Elementary School.
Ownership History
Date
Name
Owned For
Owner Type
Purchase Details
Closed on
Aug 17, 2011
Sold by
U S Bank National Association
Bought by
Ixion Properties Llc
Current Estimated Value
Purchase Details
Closed on
May 11, 2011
Sold by
Solis Abel and Lucero Noemi
Bought by
U S Bank National Association
Purchase Details
Closed on
Jul 3, 2007
Sold by
Kb Home Greater Los Angeles Inc
Bought by
Solis Abel and Lucero Noemi
Home Financials for this Owner
Home Financials are based on the most recent Mortgage that was taken out on this home.
Original Mortgage
$229,600
Interest Rate
7.05%
Mortgage Type
Stand Alone First
Purchase Details
Closed on
May 18, 2006
Sold by
Hearthstone Multi Asset Entity B
Bought by
Kb Home Greater Los Angeles Inc
Create a Home Valuation Report for This Property
The Home Valuation Report is an in-depth analysis detailing your home's value as well as a comparison with similar homes in the area
Home Values in the Area
Average Home Value in this Area
Purchase History
| Date | Buyer | Sale Price | Title Company |
|---|---|---|---|
| Ixion Properties Llc | $101,000 | Landsafe Title National Defa | |
| U S Bank National Association | $102,600 | Lps Default Title & Closing | |
| Solis Abel | $287,000 | Fidelity National Title | |
| Kb Home Greater Los Angeles Inc | -- | -- |
Source: Public Records
Mortgage History
| Date | Status | Borrower | Loan Amount |
|---|---|---|---|
| Previous Owner | Solis Abel | $229,600 |
Source: Public Records
Tax History Compared to Growth
Tax History
| Year | Tax Paid | Tax Assessment Tax Assessment Total Assessment is a certain percentage of the fair market value that is determined by local assessors to be the total taxable value of land and additions on the property. | Land | Improvement |
|---|---|---|---|---|
| 2025 | $3,731 | $126,861 | $25,121 | $101,740 |
| 2024 | $3,731 | $124,373 | $24,628 | $99,745 |
| 2023 | $3,680 | $121,934 | $24,145 | $97,789 |
| 2022 | $3,618 | $119,544 | $23,672 | $95,872 |
| 2021 | $3,545 | $117,200 | $23,208 | $93,992 |
| 2020 | $3,480 | $115,998 | $22,970 | $93,028 |
| 2019 | $3,423 | $113,724 | $22,520 | $91,204 |
| 2018 | $3,481 | $111,494 | $22,078 | $89,416 |
| 2017 | $3,419 | $109,308 | $21,645 | $87,663 |
| 2016 | $3,359 | $107,165 | $21,221 | $85,944 |
| 2015 | $3,262 | $105,555 | $20,902 | $84,653 |
| 2014 | $3,431 | $103,488 | $20,493 | $82,995 |
Source: Public Records
Map
Nearby Homes
- 16029 White Mountain Place
- 14483 Wapiti Way
- 15974 Golden Meadow Ln
- 14482 Sweetgrass Place
- 15954 Silver Tip Way
- 15953 White Cloud Way
- 16013 Papago Place
- 15753 Gable St
- 0 Air Expy
- 0 El Evado Rd Unit HD25080307
- 61 Hopland St
- 16185 Figueroa Rd
- 0 Poppy Rd
- 0 Figueroa Rd
- 14847 Ritter St
- 15543 Fairbanks Dr
- 16105 Tawney Ridge Ln
- 0 Vasquez Ave Unit 25007601
- 16217 Cahuenga Rd
- 15752 Whitecap Way
- 16023 Little Chief Place
- 16039 Little Chief Ln
- 16023 Little Chief Ln
- 14456 Red Wolf Way
- 16047 Little Chief Ln
- 16047 Little Chief Place
- 14455 Shoshone Way
- 14462 Red Wolf Way
- 16028 Little Chief Ln
- 14461 Shoshone Way
- 16036 Little Chief Ln
- 16020 Little Chief Ln
- 16044 Little Chief Place
- 14447 Red Wolf Way
- 14453 Red Wolf Way
- 14468 Red Wolf Way
- 16012 Little Chief Place
- 16044 Little Chief Ln
- 14467 Shoshone Way
- 14441 Red Wolf Way