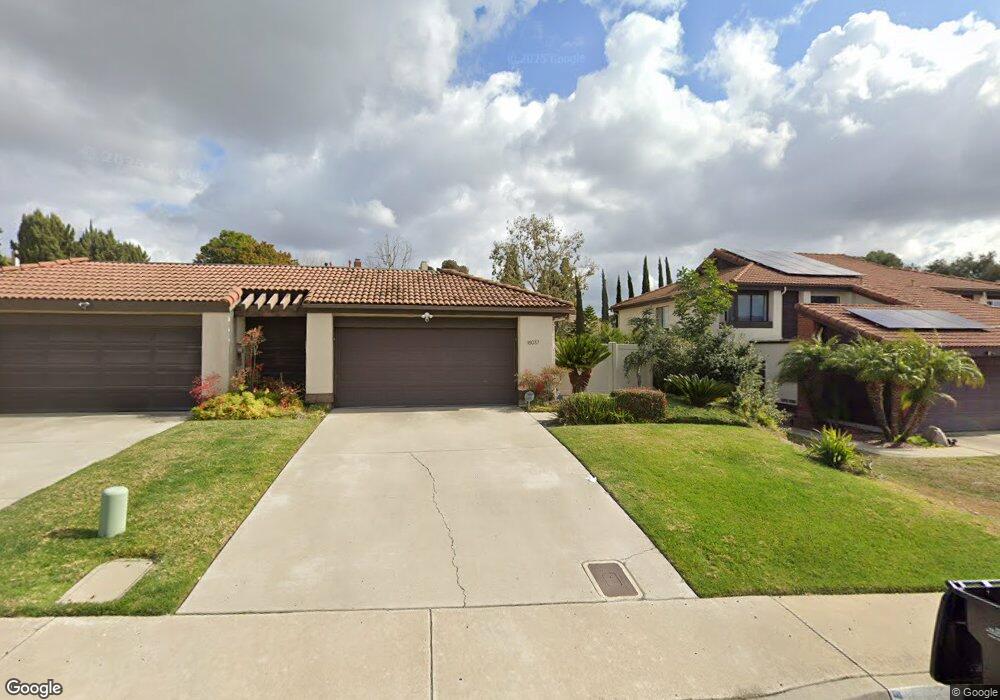
16037 Blazewood Way San Diego, CA 92127
Rancho Bernardo NeighborhoodEstimated Value: $889,395 - $1,057,000
2
Beds
2
Baths
1,240
Sq Ft
$783/Sq Ft
Est. Value
About This Home
This home is located at 16037 Blazewood Way, San Diego, CA 92127 and is currently estimated at $971,099, approximately $783 per square foot. 16037 Blazewood Way is a home located in San Diego County with nearby schools including Turtleback Elementary, Bernardo Heights Middle, and Rancho Bernardo High.
Ownership History
Date
Name
Owned For
Owner Type
Purchase Details
Closed on
Dec 21, 2023
Sold by
Martin Remedios V
Bought by
Remedios V Martin Revocable Trust and Martin
Current Estimated Value
Purchase Details
Closed on
May 22, 2020
Sold by
Martin Remedios V
Bought by
Martin Remedios Vertudes
Home Financials for this Owner
Home Financials are based on the most recent Mortgage that was taken out on this home.
Original Mortgage
$350,000
Interest Rate
3.3%
Mortgage Type
New Conventional
Purchase Details
Closed on
Jan 16, 2019
Sold by
Navarro Linda E and Navarro Linda Elizabeth
Bought by
Navarro Linda E
Purchase Details
Closed on
Dec 18, 2018
Sold by
Martin Remedios V
Bought by
Martin Remedios V
Purchase Details
Closed on
Jul 6, 2012
Sold by
Sullivan Sandra L
Bought by
Martin Remedios
Home Financials for this Owner
Home Financials are based on the most recent Mortgage that was taken out on this home.
Original Mortgage
$353,969
Interest Rate
3.65%
Mortgage Type
FHA
Purchase Details
Closed on
Oct 7, 2010
Sold by
Sullivan Sandra
Bought by
Sullivan Sandra L
Purchase Details
Closed on
Jul 27, 2010
Sold by
Sullivan Sandra L
Bought by
Sullivan Sandra L
Home Financials for this Owner
Home Financials are based on the most recent Mortgage that was taken out on this home.
Original Mortgage
$190,000
Interest Rate
4.65%
Mortgage Type
New Conventional
Purchase Details
Closed on
Oct 5, 2005
Sold by
Sullivan Sandra
Bought by
Sullivan Sandra L
Purchase Details
Closed on
May 5, 1998
Sold by
Chinn Earl S
Bought by
Sullivan Sandra
Home Financials for this Owner
Home Financials are based on the most recent Mortgage that was taken out on this home.
Original Mortgage
$137,000
Interest Rate
7.13%
Purchase Details
Closed on
May 6, 1993
Home Financials for this Owner
Home Financials are based on the most recent Mortgage that was taken out on this home.
Original Mortgage
$129,200
Interest Rate
7.2%
Purchase Details
Closed on
Apr 26, 1993
Sold by
Thoman Jeff A and Thoman Kara E
Bought by
Chinn Earl Scott
Home Financials for this Owner
Home Financials are based on the most recent Mortgage that was taken out on this home.
Original Mortgage
$129,200
Interest Rate
7.2%
Purchase Details
Closed on
Mar 9, 1989
Create a Home Valuation Report for This Property
The Home Valuation Report is an in-depth analysis detailing your home's value as well as a comparison with similar homes in the area
Home Values in the Area
Average Home Value in this Area
Purchase History
| Date | Buyer | Sale Price | Title Company |
|---|---|---|---|
| Remedios V Martin Revocable Trust | -- | None Listed On Document | |
| Martin Remedios Vertudes | -- | None Available | |
| Navarro Linda E | -- | None Available | |
| Martin Remedios V | -- | None Available | |
| Martin Remedios | $360,500 | Chicago Title Company | |
| Sullivan Sandra L | -- | None Available | |
| Sullivan Sandra L | -- | Chicago Title Company | |
| Sullivan Sandra L | -- | -- | |
| Sullivan Sandra | $172,000 | Fidelity National Title | |
| -- | $174,300 | -- | |
| Chinn Earl Scott | $161,500 | Guardian Title Company | |
| -- | $149,000 | -- |
Source: Public Records
Mortgage History
| Date | Status | Borrower | Loan Amount |
|---|---|---|---|
| Previous Owner | Martin Remedios Vertudes | $350,000 | |
| Previous Owner | Martin Remedios | $353,969 | |
| Previous Owner | Sullivan Sandra L | $190,000 | |
| Previous Owner | Sullivan Sandra | $137,000 | |
| Previous Owner | Chinn Earl Scott | $129,200 |
Source: Public Records
Tax History Compared to Growth
Tax History
| Year | Tax Paid | Tax Assessment Tax Assessment Total Assessment is a certain percentage of the fair market value that is determined by local assessors to be the total taxable value of land and additions on the property. | Land | Improvement |
|---|---|---|---|---|
| 2025 | $4,955 | $443,918 | $166,143 | $277,775 |
| 2024 | $4,955 | $435,215 | $162,886 | $272,329 |
| 2023 | $4,850 | $426,683 | $159,693 | $266,990 |
| 2022 | $4,770 | $418,317 | $156,562 | $261,755 |
| 2021 | $4,708 | $410,116 | $153,493 | $256,623 |
| 2020 | $4,645 | $405,912 | $151,920 | $253,992 |
| 2019 | $4,525 | $397,954 | $148,942 | $249,012 |
| 2018 | $4,399 | $390,152 | $146,022 | $244,130 |
| 2017 | $4,282 | $382,503 | $143,159 | $239,344 |
| 2016 | $4,194 | $375,003 | $140,352 | $234,651 |
| 2015 | $4,132 | $369,371 | $138,244 | $231,127 |
| 2014 | $4,035 | $362,136 | $135,536 | $226,600 |
Source: Public Records
Map
Nearby Homes
- 15353 Maturin Dr Unit 115
- 15273 Maturin Dr Unit 40
- 15283 Maturin Dr Unit 62
- 15373 Maturin Dr Unit 178
- 11313 Avenida de Los Lobos Unit B
- 11263 Avenida de Los Lobos Unit D
- 11781 Caminito de Las Missiones
- 11705 Via Medanos
- 16003 Caminito de Linda
- 15610 Corte Raposo
- 15985 Camino Crisalida Unit 5
- 16232 Avenida Venusto Unit B
- 16244 Avenida Venusto Unit A
- 11384 Almazon St
- 16430 Avenida Venusto Unit D
- 15541 Paseo Jenghiz
- 16205 Via Embeleso
- 11385 Paseo Albacete
- 11378 Ajanta Ct
- 12141 Iron View Row
- 16029 Blazewood Way
- 16045 Blazewood Way
- 16021 Blazewood Way
- 16053 Blazewood Way
- 16140 Big Springs Way Unit 3
- 16013 Blazewood Way
- 16061 Blazewood Way
- 16130 Big Springs Way
- 11215 Blazewood Place
- 16034 Turtleback Rd
- 16150 Big Springs Way
- 16005 Blazewood Way
- 16069 Blazewood Way Unit 3
- 16046 Turtleback Rd
- 11225 Blazewood Place
- 16060 Blazewood Way
- 15996 Turtleback Rd
- 16058 Turtleback Rd
- 11235 Blazewood Place
- 15988 Turtleback Rd