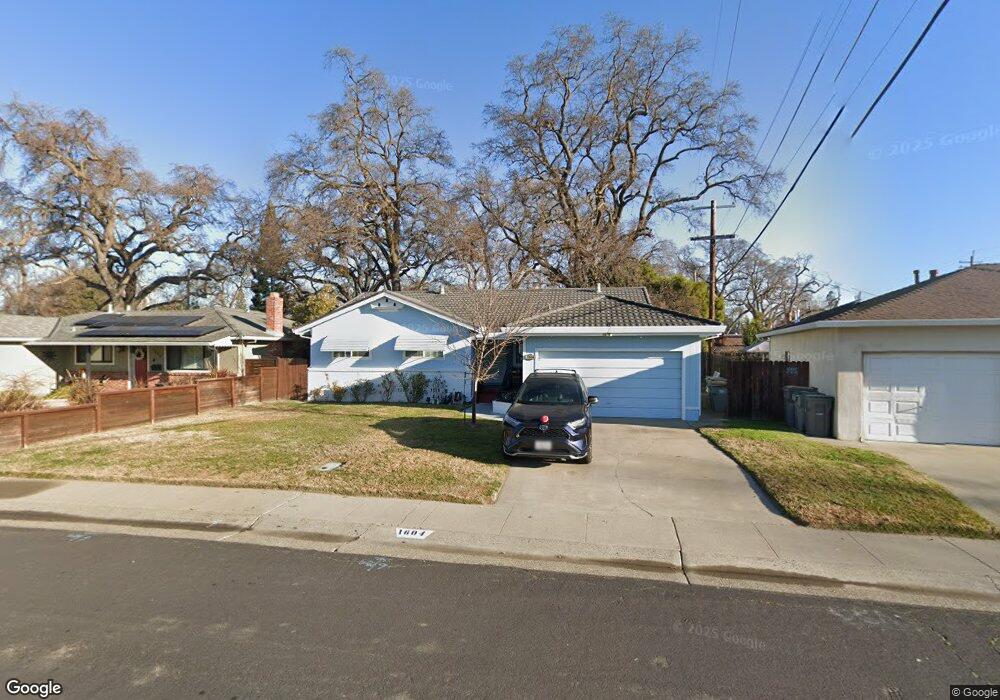
1604 19th St West Sacramento, CA 95691
Old West Sacramento NeighborhoodEstimated Value: $373,000 - $538,000
3
Beds
2
Baths
1,570
Sq Ft
$310/Sq Ft
Est. Value
About This Home
This home is located at 1604 19th St, West Sacramento, CA 95691 and is currently estimated at $486,577, approximately $309 per square foot. 1604 19th St is a home located in Yolo County with nearby schools including Westmore Oaks Elementary School, River City High, and Sacramento Valley Charter School.
Ownership History
Date
Name
Owned For
Owner Type
Purchase Details
Closed on
Jan 13, 2017
Sold by
Mckechnie Elisabeth and Mckechnie William
Bought by
Mckechnie William R and Mckechnie Elisabeth M
Current Estimated Value
Home Financials for this Owner
Home Financials are based on the most recent Mortgage that was taken out on this home.
Original Mortgage
$235,000
Outstanding Balance
$117,094
Interest Rate
4.13%
Mortgage Type
New Conventional
Estimated Equity
$369,483
Purchase Details
Closed on
Aug 18, 2009
Sold by
Mckinnon Dennis F and Mckinnon Timothy F
Bought by
Mckechnie Elisabeth and Mckechnie William
Home Financials for this Owner
Home Financials are based on the most recent Mortgage that was taken out on this home.
Original Mortgage
$202,268
Interest Rate
5.17%
Mortgage Type
FHA
Purchase Details
Closed on
Feb 4, 2009
Sold by
Mckinnon Timothy F M and Mckinnon Roy M
Bought by
Mckinnon Timothy F
Purchase Details
Closed on
May 8, 1995
Sold by
Mckinnon Roy M and Mckinnon Eleanor M
Bought by
Mckinnon Roy Mark and Mckinnon Eleanor Margaret
Create a Home Valuation Report for This Property
The Home Valuation Report is an in-depth analysis detailing your home's value as well as a comparison with similar homes in the area
Home Values in the Area
Average Home Value in this Area
Purchase History
| Date | Buyer | Sale Price | Title Company |
|---|---|---|---|
| Mckechnie William R | -- | Fidelity National Title Co | |
| Mckechnie Elisabeth | $206,000 | Placer Title Company | |
| Mckinnon Timothy F | -- | None Available | |
| Mckinnon Dennis F | -- | None Available | |
| Mckinnon Roy Mark | -- | -- |
Source: Public Records
Mortgage History
| Date | Status | Borrower | Loan Amount |
|---|---|---|---|
| Open | Mckechnie William R | $235,000 | |
| Closed | Mckechnie Elisabeth | $202,268 |
Source: Public Records
Tax History Compared to Growth
Tax History
| Year | Tax Paid | Tax Assessment Tax Assessment Total Assessment is a certain percentage of the fair market value that is determined by local assessors to be the total taxable value of land and additions on the property. | Land | Improvement |
|---|---|---|---|---|
| 2025 | $3,090 | $265,259 | $90,135 | $175,124 |
| 2023 | $3,090 | $254,961 | $86,636 | $168,325 |
| 2022 | $2,879 | $249,963 | $84,938 | $165,025 |
| 2021 | $2,855 | $245,063 | $83,273 | $161,790 |
| 2020 | $2,720 | $242,552 | $82,420 | $160,132 |
| 2019 | $2,686 | $237,797 | $80,804 | $156,993 |
| 2018 | $2,635 | $233,135 | $79,220 | $153,915 |
| 2017 | $2,608 | $228,565 | $77,667 | $150,898 |
| 2016 | $2,569 | $224,085 | $76,145 | $147,940 |
| 2015 | $2,310 | $220,720 | $75,002 | $145,718 |
| 2014 | $2,310 | $210,000 | $60,000 | $150,000 |
Source: Public Records
Map
Nearby Homes
- 1916 Park Blvd
- 1826 Maryland Ave
- 1911 Vermont Ave
- 1549 Virginia Ave
- 1043 Park Blvd
- 1021 Sycamore Ave
- 1655 Fathom Place
- 1925 Proctor Ave
- 2321 Kinsington St
- 1908 Proctor Ave
- 1925 Willow Ave
- 830 Pecan St
- 1584 Gateway Dr
- 2000 W Capitol Ave Unit 125
- 0 Jefferson Blvd Unit 225119728
- 1832 Rockrose Rd
- 235 Touchstone Place
- 209 Touchstone Place
- 1003 Central St
- 710 Glide Ave Unit 66