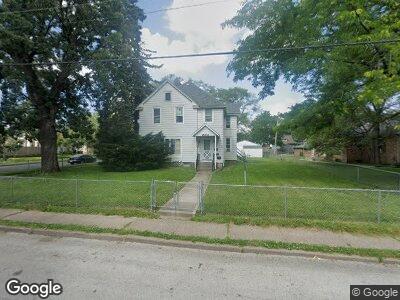
1604 Farnam St Davenport, IL 52803
Central Davenport NeighborhoodEstimated Value: $103,000 - $130,861
3
Beds
3
Baths
2,058
Sq Ft
$55/Sq Ft
Est. Value
About This Home
This home is located at 1604 Farnam St, Davenport, IL 52803 and is currently estimated at $114,215, approximately $55 per square foot. 1604 Farnam St is a home located in Scott County with nearby schools including Madison Elementary School, Sudlow Intermediate School, and Central High School.
Ownership History
Date
Name
Owned For
Owner Type
Purchase Details
Closed on
Oct 25, 2022
Sold by
Stickel Cole
Bought by
Stickel Capital Llc
Current Estimated Value
Purchase Details
Closed on
Mar 23, 2020
Sold by
Lodge Donovan L and Lodge Shawna
Bought by
Stickel Cole T
Home Financials for this Owner
Home Financials are based on the most recent Mortgage that was taken out on this home.
Original Mortgage
$82,478
Interest Rate
3.3%
Mortgage Type
FHA
Purchase Details
Closed on
Feb 21, 2013
Sold by
Rindal Jeff and Rindal Teresa
Bought by
Lodge Donovan L
Home Financials for this Owner
Home Financials are based on the most recent Mortgage that was taken out on this home.
Original Mortgage
$44,000
Interest Rate
3.34%
Mortgage Type
Future Advance Clause Open End Mortgage
Purchase Details
Closed on
May 8, 2012
Sold by
Ensminger Joyce and Ensminger Jerald
Bought by
Rindal Jeff and Rindal Teresa T
Purchase Details
Closed on
Oct 6, 2006
Sold by
Rieke Robert Leroy and Rieke Robert L
Bought by
Rieke Robert Leroy and Ensminger Joyce
Create a Home Valuation Report for This Property
The Home Valuation Report is an in-depth analysis detailing your home's value as well as a comparison with similar homes in the area
Home Values in the Area
Average Home Value in this Area
Purchase History
| Date | Buyer | Sale Price | Title Company |
|---|---|---|---|
| Stickel Capital Llc | -- | -- | |
| Stickel Cole T | $84,000 | Gomez Title And Closing Co | |
| Lodge Donovan L | $55,000 | None Available | |
| Rindal Jeff | $67,000 | None Available | |
| Rieke Robert Leroy | -- | None Available |
Source: Public Records
Mortgage History
| Date | Status | Borrower | Loan Amount |
|---|---|---|---|
| Previous Owner | Stickel Cole T | $82,478 | |
| Previous Owner | Lodge Donovan L | $44,000 |
Source: Public Records
Tax History Compared to Growth
Tax History
| Year | Tax Paid | Tax Assessment Tax Assessment Total Assessment is a certain percentage of the fair market value that is determined by local assessors to be the total taxable value of land and additions on the property. | Land | Improvement |
|---|---|---|---|---|
| 2024 | $2,413 | $105,990 | $24,940 | $81,050 |
| 2023 | $2,670 | $105,990 | $24,940 | $81,050 |
| 2022 | $2,238 | $84,980 | $15,750 | $69,230 |
| 2021 | $1,824 | $84,980 | $15,750 | $69,230 |
| 2020 | $1,516 | $69,750 | $15,750 | $54,000 |
| 2019 | $1,566 | $69,750 | $15,750 | $54,000 |
| 2018 | $298 | $69,750 | $15,750 | $54,000 |
| 2017 | $373 | $67,050 | $15,750 | $51,300 |
| 2016 | $1,920 | $72,670 | $0 | $0 |
| 2015 | $1,592 | $73,000 | $0 | $0 |
| 2014 | $1,622 | $73,000 | $0 | $0 |
| 2013 | $1,594 | $0 | $0 | $0 |
| 2012 | -- | $83,070 | $18,270 | $64,800 |
Source: Public Records
Map
Nearby Homes
- 618 Douglas Ct
- 412 E 15th St
- 1421 Grand Ave
- 1810 Davenport Ave
- 321 E 15th St
- 1418 Iowa St
- 1812 Pershing Ave
- 601 E Laurel St
- 810 E Locust St
- 2023 Leclaire St
- 811 E 14th St Unit 1-11
- 204 E 18th St
- 918 Arlington Ct
- 232 E 13th St
- 916 E 14th St
- 122 E 17th St
- 115 E 18th St
- 1015 Arlington Ct
- 1703 Brady St
- 925 E 14th St
- 1604 Farnam St
- 1604 Farnam St
- 1604 Farnam St Unit 2
- 1604 Farnam St Unit 1
- 1612 Farnam St
- 1612 - 1614 Farnam
- 604 Kirkwood Blvd
- 1704 Farnam St
- 512 Kirkwood Blvd
- 1530 Farnam St
- 1708 Farnam St
- 608 Kirkwood Blvd
- 508 Kirkwood Blvd
- 1701 Farnam St
- 1615 Leclaire St
- 1712 Farnam St
- 511 Kirkwood Blvd
- 1703 Farnam St
- 1701 Leclaire St
- 504 Kirkwood Blvd