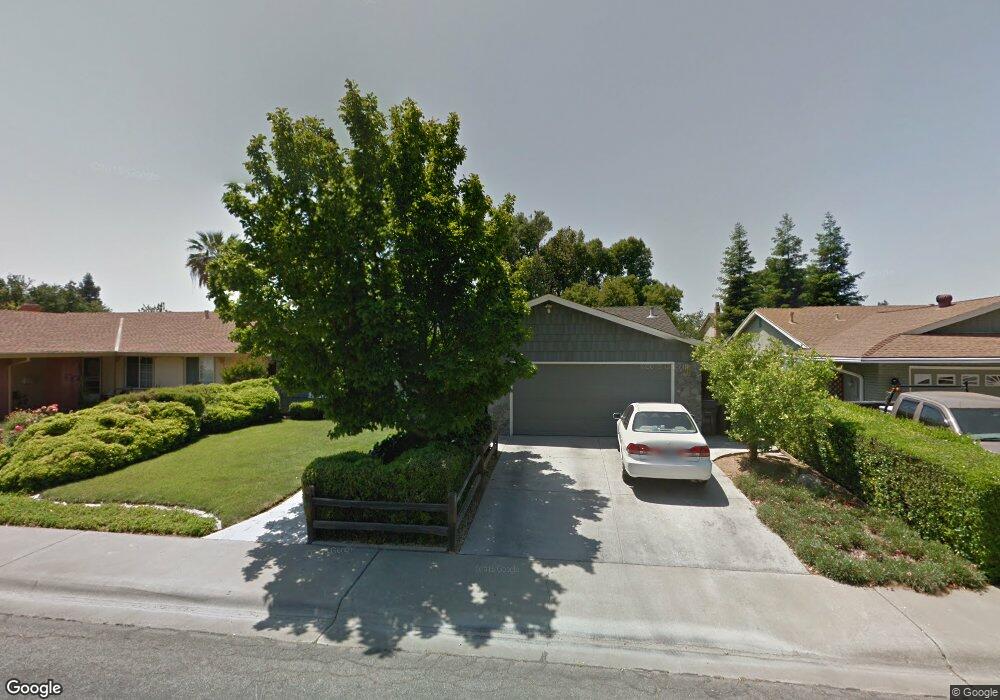
1604 Grove Ave Woodland, CA 95695
Estimated Value: $441,000 - $527,000
3
Beds
2
Baths
1,534
Sq Ft
$323/Sq Ft
Est. Value
About This Home
This home is located at 1604 Grove Ave, Woodland, CA 95695 and is currently estimated at $494,915, approximately $322 per square foot. 1604 Grove Ave is a home located in Yolo County with nearby schools including Zamora Elementary School, Lee Middle School, and Woodland Senior High School.
Ownership History
Date
Name
Owned For
Owner Type
Purchase Details
Closed on
Jan 23, 2004
Sold by
Atwell Victoria M and Atwell Family Trust
Bought by
Atwell Victoria M and Victoria M Atwell Revocable Tr
Current Estimated Value
Purchase Details
Closed on
Sep 8, 2003
Sold by
Atwell Victoria M
Bought by
Atwell Victoria M and Atwell Family Trust
Home Financials for this Owner
Home Financials are based on the most recent Mortgage that was taken out on this home.
Original Mortgage
$106,379
Interest Rate
6.06%
Mortgage Type
Purchase Money Mortgage
Purchase Details
Closed on
Oct 6, 1998
Sold by
Atwell Raymond and Atwell Victoria
Bought by
Atwell Raymond P and Atwell Victoria M
Home Financials for this Owner
Home Financials are based on the most recent Mortgage that was taken out on this home.
Original Mortgage
$113,250
Interest Rate
6.88%
Purchase Details
Closed on
Apr 10, 1998
Sold by
Atwell Raymond and Atwell Victoria
Bought by
Atwell Raymond P and Atwell Victoria M
Create a Home Valuation Report for This Property
The Home Valuation Report is an in-depth analysis detailing your home's value as well as a comparison with similar homes in the area
Home Values in the Area
Average Home Value in this Area
Purchase History
| Date | Buyer | Sale Price | Title Company |
|---|---|---|---|
| Atwell Victoria M | -- | -- | |
| Atwell Victoria M | -- | North American Title | |
| Atwell Victoria M | -- | North American Title | |
| Atwell Raymond P | -- | -- | |
| Atwell Raymond P | -- | North American Title Guarant | |
| Atwell Raymond P | -- | -- |
Source: Public Records
Mortgage History
| Date | Status | Borrower | Loan Amount |
|---|---|---|---|
| Closed | Atwell Victoria M | $106,379 | |
| Closed | Atwell Raymond P | $113,250 |
Source: Public Records
Tax History Compared to Growth
Tax History
| Year | Tax Paid | Tax Assessment Tax Assessment Total Assessment is a certain percentage of the fair market value that is determined by local assessors to be the total taxable value of land and additions on the property. | Land | Improvement |
|---|---|---|---|---|
| 2025 | $855 | $90,030 | $16,137 | $73,893 |
| 2023 | $855 | $86,536 | $15,511 | $71,025 |
| 2022 | $818 | $84,840 | $15,207 | $69,633 |
| 2021 | $804 | $83,177 | $14,909 | $68,268 |
| 2020 | $792 | $82,325 | $14,757 | $67,568 |
| 2019 | $775 | $80,712 | $14,468 | $66,244 |
| 2018 | $766 | $79,131 | $14,185 | $64,946 |
| 2017 | $748 | $77,580 | $13,907 | $63,673 |
| 2016 | $734 | $76,060 | $13,635 | $62,425 |
| 2015 | $707 | $74,919 | $13,431 | $61,488 |
| 2014 | $707 | $73,452 | $13,168 | $60,284 |
Source: Public Records
Map
Nearby Homes
- 754 Fordham Place
- 837 Lewis Ave
- 1200 Evergreen Ct
- 206 Los Robles Way
- 909 Harvard Place
- 910 Notre Dame Dr
- 637 Knollwood Dr
- 420 W Southwood Dr
- 1208 West St
- 1240 Eunice Dr
- 725 Fairview Dr
- 801-803 California St
- 742 W Cross St
- 6 Southwood Dr
- 1609 Mckinley Ave
- 648 California St
- 628 California St
- 737 Heather Ln
- 956 W Cross St
- 805 W Lincoln Ave
- 1608 Grove Ave
- 1600 Grove Ave
- 1607 Inverness Dr
- 1612 Grove Ave
- 1611 Inverness Dr
- 1603 Inverness Dr
- 1601 Grove Ave
- 1615 Inverness Dr
- 1607 Grove Ave
- 1616 Grove Ave
- 1611 Grove Ave
- 636 Lewis Ave
- 1619 Inverness Dr
- 632 Lewis Ave
- 628 Lewis Ave
- 1615 Grove Ave
- 1620 Grove Ave
- 624 Lewis Ave
- 1610 Inverness Dr
- 1606 Inverness Dr