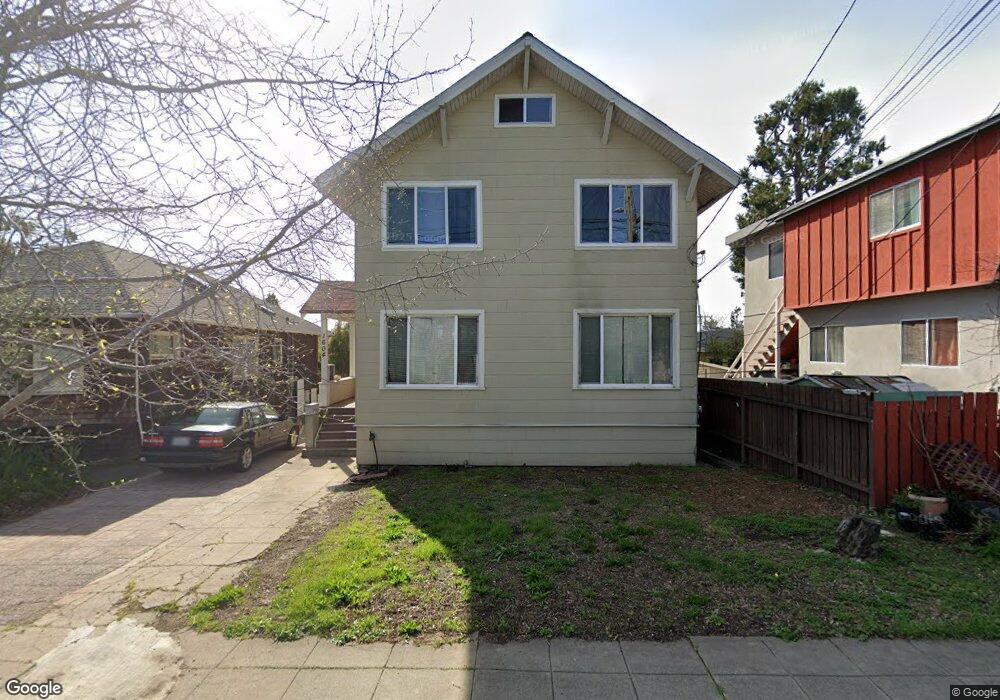
1604 Josephine St Berkeley, CA 94703
North Berkeley NeighborhoodEstimated Value: $1,063,000 - $16,266,923
4
Beds
3
Baths
2,194
Sq Ft
$2,263/Sq Ft
Est. Value
About This Home
This home is located at 1604 Josephine St, Berkeley, CA 94703 and is currently estimated at $4,964,981, approximately $2,262 per square foot. 1604 Josephine St is a home located in Alameda County with nearby schools including Berkeley Arts Magnet at Whittier School, Washington Elementary School, and Oxford Elementary School.
Ownership History
Date
Name
Owned For
Owner Type
Purchase Details
Closed on
Nov 22, 2002
Sold by
Means Kendall D and Means Kathryn
Bought by
Means Steven and Means Naomi
Current Estimated Value
Home Financials for this Owner
Home Financials are based on the most recent Mortgage that was taken out on this home.
Original Mortgage
$405,000
Outstanding Balance
$158,374
Interest Rate
5.12%
Mortgage Type
Purchase Money Mortgage
Estimated Equity
$4,806,607
Purchase Details
Closed on
Oct 8, 1997
Sold by
Grass Richard A and Grass Helga
Bought by
Means Steven and Means Naomi
Home Financials for this Owner
Home Financials are based on the most recent Mortgage that was taken out on this home.
Original Mortgage
$265,600
Interest Rate
7.54%
Purchase Details
Closed on
Jul 23, 1997
Sold by
Grass Arved G and Grass Lillian B
Bought by
Grass Richard A
Create a Home Valuation Report for This Property
The Home Valuation Report is an in-depth analysis detailing your home's value as well as a comparison with similar homes in the area
Home Values in the Area
Average Home Value in this Area
Purchase History
| Date | Buyer | Sale Price | Title Company |
|---|---|---|---|
| Means Steven | $202,500 | Old Republic Title Company | |
| Means Steven | $3,018,181 | First American Title Guarant | |
| Grass Richard A | -- | -- |
Source: Public Records
Mortgage History
| Date | Status | Borrower | Loan Amount |
|---|---|---|---|
| Open | Means Steven | $405,000 | |
| Closed | Means Steven | $265,600 |
Source: Public Records
Tax History
| Year | Tax Paid | Tax Assessment Tax Assessment Total Assessment is a certain percentage of the fair market value that is determined by local assessors to be the total taxable value of land and additions on the property. | Land | Improvement |
|---|---|---|---|---|
| 2025 | $10,640 | $530,094 | $159,028 | $371,066 |
| 2024 | $10,640 | $519,701 | $155,910 | $363,791 |
| 2023 | $10,391 | $509,513 | $152,854 | $356,659 |
| 2022 | $10,144 | $499,523 | $149,857 | $349,666 |
| 2021 | $10,126 | $489,728 | $146,918 | $342,810 |
| 2020 | $9,447 | $484,710 | $145,413 | $339,297 |
| 2019 | $8,924 | $475,207 | $142,562 | $332,645 |
| 2018 | $8,741 | $465,891 | $139,767 | $326,124 |
| 2017 | $8,413 | $456,758 | $137,027 | $319,731 |
| 2016 | $8,044 | $447,804 | $134,341 | $313,463 |
| 2015 | $7,922 | $441,078 | $132,323 | $308,755 |
| 2014 | $7,957 | $432,438 | $129,731 | $302,707 |
Source: Public Records
Map
Nearby Homes
- 1808 Cedar St
- 1625 Martin Luther King jr Way
- 1609 Bonita Ave Unit 5
- 1610 Milvia St
- 1425 Martin Luther King jr Way
- 1408 Henry St
- 1564 Sacramento St
- 1626 Hopkins St
- 1444 Walnut St
- 1682 Oxford St
- 1813 Sacramento St
- 2201 Virginia St Unit 2
- 1519 Oxford St Unit E
- 1515 Oxford St Unit 1D
- 2112 Mckinley Ave Unit D
- 1368 Rose St
- 2218 -2222 Grant St
- 1739 Spruce St
- 1411 Hearst Ave Unit 2
- 2118 California St
- 1608 Josephine St
- 1814 Cedar St
- 1822 Cedar St
- 1612 Josephine St
- 1806 Cedar St
- 1614 Josephine St
- 1607 Grant St
- 1826 Cedar St
- 1616 Josephine St
- 1611 Grant St
- 1605 Grant St
- 1607 Josephine St
- 1828 Cedar St
- 1615 Grant St
- 1809 Cedar St
- 1811 Cedar St
- 1609 Josephine St
- 1807 Cedar St
- 1805 Cedar St
- 1540 Josephine St
Your Personal Tour Guide
Ask me questions while you tour the home.